Appendix G NAEP 2022 Sample Design
NAEP 2026 Appendix G v.36.docx
National Assessment of Educational Progress (NAEP) 2026
Appendix G NAEP 2022 Sample Design
OMB: 1850-0928
NATIONAL CENTER FOR EDUCATION STATISTICS
NATIONAL ASSESSMENT OF EDUCATIONAL PROGRESS
National Assessment of Educational Progress (NAEP) 2026
Appendix G
NAEP 2022 Sample Design
OMB# 1850-0928 v.36
May 2025
The 2022 Sample Design documentation is the most current version available to the public for state level NAEP assessment year. At this time, there is not a timeline for when the details for later assessment years will be publicly available.
NAEP Technical Documentation Website
NAEP Technical Documentation NAEP 2022 Sample Design
The sample design for NAEP 2022 included samples for various operational assessments. Representative samples were drawn for the following operational assessments:
![]() long-term trend
(LTT) age
9 and
age 13
national assessments
in mathematics
and reading
in public
and private
schools;
long-term trend
(LTT) age
9 and
age 13
national assessments
in mathematics
and reading
in public
and private
schools;
![]() national assessments in civics and U.S. history in public and
private schools at grade 8;
national assessments in civics and U.S. history in public and
private schools at grade 8;
![]() national assessments in mathematics and reading in private
schools at grades 4 and 8; and
national assessments in mathematics and reading in private
schools at grades 4 and 8; and
![]() state-by-state
assessments and
Trial Urban
District Assessments
(TUDA) in
mathematics and
reading in
public schools
at grades 4 and 8.
state-by-state
assessments and
Trial Urban
District Assessments
(TUDA) in
mathematics and
reading in
public schools
at grades 4 and 8.
The samples
for the
operational assessments
were organized
into eight
distinct groupings
and sampled
separately as
follows:
![]() mathematics and reading assessments in public schools at
grades 4 and 8;
mathematics and reading assessments in public schools at
grades 4 and 8;
![]() mathematics and
reading assessments
in private
schools at
grades 4
and 8;
mathematics and
reading assessments
in private
schools at
grades 4
and 8;
![]() civics and U.S. history assessments in public schools at
grade 8;
civics and U.S. history assessments in public schools at
grade 8;
![]() civics and U.S. history assessments in private schools at
grade 8;
civics and U.S. history assessments in private schools at
grade 8;
![]() mathematics and
reading LTT
assessments in
public schools
at age
9;
mathematics and
reading LTT
assessments in
public schools
at age
9;
![]() mathematics and
reading LTT
assessments in
private schools
at age
9;
mathematics and
reading LTT
assessments in
private schools
at age
9;
![]() mathematics and
reading LTT
assessments in
public schools
at age
13; and
mathematics and
reading LTT
assessments in
public schools
at age
13; and
![]() mathematics and reading LTT assessments in private schools at
age 13.
mathematics and reading LTT assessments in private schools at
age 13.
2022 State Assessment Sample Design
2022 National Grade-Based Assessment Sample Design
2022 National Long-Term Trend Assessment Sample Design
The grade 4 and grade 8 assessments were all digitally based assessments (DBA) administered using tablets. The LTT assessments were paper-based assessments (PBA) administered using paper and pencil. LTT age 9 was administered in the winter of 2022 and LTT age 13 was administered in the fall of 2022 (in a different school year than age 9).
The national assessments were designed to achieve nationally representative samples of public and private school students in the fourth or eighth grades (or public and private school students who were age 9 or 13 in the case of LTT). The target populations included all students in public, private, Bureau of Indian Education (BIE), and Department of Defense Education Activity (DoDEA) schools who were enrolled in grades 4 or 8 (or who were age 9 or 13 in the case of LTT) at the time of assessment. DoDEA schools for LTT and the grade 8 civics and U.S. history assessments were limited to those located in the U.S. (not overseas).
For the fourth- and eighth-grade mathematics and reading assessments in public schools, the TUDA samples formed part of the corresponding state public school samples, and the state samples formed the public school grades 4 and 8 part of the national sample. Nationally representative samples were drawn for civics and U.S. history and for the remaining populations of private school students, DoDEA students, and BIE students separately by grade.
The state assessments were designed to achieve representative samples of students in the respective grade. At grades 4 and 8, the target populations included all students in each participating jurisdiction, which included states, District of Columbia, BIE, DoDEA, and school districts chosen for the TUDA. For each grade and assessment
subject, samples were designed to produce aggregate estimates with adequate precision for all the participating jurisdictions, as well as estimates for various student subpopulations of interest.
A one-time feature of some of the 2022 samples was maximum overlap with other earlier NAEP samples. This was done to facilitate certain analyses related to the fact that 2022 was the first assessment year after the COVID-19 pandemic. The state samples were selected to have maximum overlap with the school samples for the NAEP 2021 Monthly School Survey and the NAEP 2021 School and Teacher Questionnaire Study. The LTT samples were selected to have maximum overlap with the NAEP 2020 LTT age 9 and age 13 school samples, respectively. This overlap control was achieved for these samples by using an adaptation of the Keyfitz process.
The figure below illustrates the various sample types and subjects.
Components of the NAEP samples, by assessment subject, grade or age, and school type: 2022
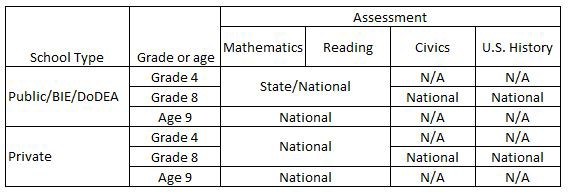
SOURCE: U.S. Department of Education, Institute of Education Sciences, National Center for Education Statistics, National Assessment of Educational Progress (NAEP), 2022 Assessments.
http://nces.ed.gov/nationsreportcard/tdw/sample_design/2022/naep_2022_sample_design.aspx
NAEP Technical Documentation Sample Design for the 2022 National Grade-Based Assessment
The 2022 national assessment included operational assessments in mathematics and reading in public and private schools at grades 4 and 8, and operational assessments in civics and U.S. history in public and private schools at grade 8.
The sample designs aimed to achieve nationally representative samples of students in the defined populations who were enrolled at the time of assessment.
The samples were based on a two-stage sample design:
4th and 8th Grade Public School National Mathematics and Reading Assessment
4th and 8th Grade Private School National Mathematics and Reading Assessment
![]() selection of
schools within
strata; and
selection of
schools within
strata; and
![]() selection of students within schools.
selection of students within schools.
The samples of schools were selected with probability proportional to a measure of size based on the estimated grade-specific enrollment in the schools.
For fourth- and eighth-grade public schools, the aggregate of the NAEP state student samples and assessments in mathematics and reading constitute the corresponding NAEP national student samples and assessments.
The samples
for the
remaining national
assessments were
organized into
three distinct
groupings and
selected separately:
![]() mathematics and reading assessments in private schools at
grades 4 and 8;
mathematics and reading assessments in private schools at
grades 4 and 8;
![]() civics and
U.S. history
assessments in
public schools
at grade
8; and
civics and
U.S. history
assessments in
public schools
at grade
8; and
![]() civics and U.S. history assessments in private schools at
grade 8.
civics and U.S. history assessments in private schools at
grade 8.
All of the grade 4 and grade 8 assessments were digitally based assessments (DBA) administered using tablets.
8th Grade Public School National Civics and U.S. History Assessment
8th Grade Private School National Civics and U.S. History Assessment
NAEP Technical Documentation 2022 Eighth-Grade Private School National Assessment in Civics and U.S. History
The eighth-grade private school samples for the national assessments in civics and U.S. history were designed to produce nationally representative samples of students enrolled in grade eight in private schools in the United States. The target sample sizes of assessed students for the grade eight private school sample was 1,600 (800 per subject). Prior to sampling, the target sample sizes were adjusted upward to offset expected school and student attrition due to nonresponse and ineligibility.
Samples were selected using a two-stage probability-based design that involved selection of schools from within strata and selection of students within schools. The first-stage sample of schools was selected with probability proportional to a measure of size based on estimated grade-specific enrollment in the schools.
The sampling of students at the second-stage involved two steps: (1) sampling of students in the targeted grade (eighth) from each sampled school, (2) assignment of assessment subject (civics or U.S. history) to the sampled students.
Target Population Sampling Frame Stratification of Schools School Sample Selection Substitute Schools Ineligible Schools Student Sample Selection
School and Student Participation
NAEP Technical Documentation Ineligible Schools for the 2022 Eighth-Grade Private School National Assessment in Civics and U.S. History
The Private School Universe Survey (PSS)-based sampling frame school file, from which most of the sampled schools were drawn, corresponds to the 2019–2020 school year, two years prior to the assessment school year. During the intervening period, some of these schools either closed, no longer offered the grade of interest, or were ineligible for other reasons. In such cases, the sampled schools were coded as ineligible.
Total and Eligible Schools Sampled
Eligibility Status of Schools Sampled
NAEP Technical Documentation Eligibility Status of Schools Sampled for the 2022 Eighth-Grade Private School National Assessment in Civics and U.S. History
The following table shows the unweighted counts and percentages of sampled schools that were eligible and ineligible, by reason for ineligibility, for the eighth-grade private school sample for the national assessments in civics and U.S. history.
Sampled private schools, eighth-grade national assessment, by eligibility status: 2022
-
Eligibility status
Unweighted count of schools
Unweighted percentage
All sampled private schools
170
100.00
Eligible
130
79.29
Ineligible
35
20.71
Has sampled grade, but no eligible students
2
1.18
Does not have sampled grade
8
4.73
Closed
7
4.14
Not a regular school
17
10.06
Duplicate on sampling frame
0
0.00
Other ineligible school
1
0.59
NOTE: Numbers of schools are rounded to nearest ten, except those pertaining to ineligible schools. Detail may not sum to total due to rounding. Percentages are based on unrounded counts.
SOURCE: U.S. Department of Education, Institute of Education Sciences, National Center for Education Statistics, National Assessment of Educational Progress (NAEP), 2022 National Civics and U.S. History Assessments.
NAEP Technical Documentation Total and Eligible Sampled Schools for the 2022 Eighth-Grade Private School National Assessment in Civics and U.S. History
The following table presents unweighted counts and percentages of ineligible and eligible schools by private school affiliation in the eighth-grade private school sample for the national assessments in civics and U.S. history. Schools whose private school affiliation was unknown at the time of sampling subsequently had their affiliation determined during data collection. Therefore, such schools are not broken out separately and not included in the following table.
Eligibility status of sampled private schools, eighth-grade national assessment, by private school type: 2022
-
Private school type
Eligibility status
Unweighted count
Unweighted percentage
All private
Total
140
100.00
Ineligible
20
14.29
Eligible
120
85.71
Roman Catholic
Total
40
100.00
Ineligible
0
0.22
Eligible
40
100.00
Other private
Total
110
100.00
Ineligible
20
18.18
Eligible
90
81.82
NOTE: Numbers of schools are rounded to nearest ten. Detail may not sum to total due to rounding. Percentages are based on unrounded counts.
SOURCE: U.S. Department of Education, Institute of Education Sciences, National Center for Education Statistics, National Assessment of Educational Progress (NAEP), 2022 National Civics and U.S. History Assessments.
NAEP Technical Documentation Sampling Frame for the 2022 Eighth-Grade Private School National Assessment in Civics and U.S. History
The primary sampling frame for the 2022 eighth-grade private school sample for the national assessments in civics and U.S. history was developed from the Private School Universe Survey (PSS) corresponding to the 2019–2020 school year. The PSS file is the Department of Education’s primary database of elementary and secondary private schools in the 50 states and the District of Columbia, and it is based on a survey conducted by the U.S. Census Bureau during the 2019–2020 school year.
This sampling frame is referred to as the PSS-based sampling frame.
Nonrespondents to the PSS were also included in the primary sampling frame. Since these schools did not respond to the
Eighth-Grade Schools and Enrollment New-School Sampling Frame
PSS, their private school affiliation are unknown. Because NAEP response rates differ vastly by affiliation, to better estimate the target sample size of schools for each affiliation, additional work was done to obtain affiliation for these PSS nonrespondents. If a nonresponding school responded to a previous PSS (either two or four years prior), affiliation was obtained from the previous response. For those schools that were nonrespondents for the last two cycles of the PSS, in some cases internet research was used to establish affiliation. There were still schools with unknown affiliation remaining after this process.
A secondary sampling frame was also created for this sample to account for schools that newly opened or became newly eligible between the 2019–2020 and 2021–2022 school years. This frame contains brand-new and newly-eligible eighth-grade schools and is referred to as the new-school sampling frame. Because there are no sources available to identify new schools for non-Catholic private schools, the new-school frame for private schools contains only Catholic schools.
Both sets of sampling frames excluded schools that were ungraded, provided only special education, were part of hospital or treatment center programs, were juvenile correctional institutions, were home-school entities, or were for adult education.
NAEP Technical Documentation Eighth-Grade Schools and Enrollment in the 2022 Private School Civics and U.S. History Sampling Frame
The following table presents the numbers of eighth-grade private schools and estimated enrollments, as contained in the Private School Universe Survey (PSS)-based sampling frame, by private school affiliation, for the national assessments in civics and U.S. history.
The counts presented below are of schools with known affiliation. Schools with unknown affiliation do not appear in the table because their grade span, affiliation, and enrollment were unknown. Although PSS is a school universe survey, participation is voluntary and not all private schools respond. Since the NAEP sample must represent all private schools, not just PSS respondents, a small sample of PSS nonrespondents with unknown affiliation was selected to improve NAEP coverage.
Number of schools and enrollment in eighth-grade private school sampling frame, national assessment, by affiliation: 2022
-
Affiliation
Number of schools
Estimated enrollment
Total
16,808
314,627
Catholic
4,426
123,133
SOURCE: U.S. Department of Education, Institute of Education Sciences, National Center for Education Statistics, National Assessment of Educational Progress (NAEP), 2022 National Civics and U.S. History Assessments.
Affiliation Number of schools Estimated enrollment
-
Non-Catholic
12,382
191,494
SOURCE: U.S. Department of Education, Institute of Education Sciences, National Center for Education Statistics, National Assessment of Educational Progress (NAEP), 2022 National Civics and U.S. History Assessments.
NAEP Technical Documentation New-School Sampling Frame for the 2022 Eighth- Grade Private School National Assessment in Civics and U.S. History
The NAEP 2022 private school frame was constructed using the most current Private School Universe Survey (PSS) file available from NCES. This file contained schools that were in existence during the 2019–2020 school year (i.e., it was two years out of date). During the subsequent 2-year period, undoubtedly, some schools closed, some changed structure (one school becoming two schools, for example), some newly opened, and still others changed their grade span.
A supplemental sample was selected from a list of Catholic schools that were new or had become newly eligible sometime after the 2019–2020 school year. The goal was to allow every new Catholic school a chance of selection, thereby fully covering the target population of Catholic schools in operation during the 2021–2022 school year. It was infeasible to ask every Catholic diocese in the United States to provide a supplemental school frame, so a two-stage procedure was employed. First, a sample of dioceses was selected. Then the National Catholic Educational Association (NCEA) was sent a list of the schools within their sampled dioceses that had been present on the 2019–2020 PSS file. NCEA was asked to add in any new schools and update grade span for the schools on this list.
The new-school process began with the preparation of a diocese-level frame. The starting point was a file containing every Catholic diocese in the United States classified as small, medium, or large based on the number of schools and student enrollment of schools from the PSS private school frame.
A diocese was considered to be small if it contained no more than one school at each targeted grade (4 and 8). During school recruitment, schools sampled from small dioceses were asked to identify schools within their dioceses that newly offered the targeted grade. Every identified new school was added to the sample. From a sampling perspective, the new school was viewed as an "annex" to the sampled school, which meant that it had a well-defined probability of selection equal to that of the sampled school. When
a school in a small diocese was sampled from the PSS frame, its associated new school was automatically sampled as well.
Dioceses that were not small were further divided into two strata, one containing large-size dioceses and a second containing medium-size dioceses. These strata were defined by computing the percentage of grade 4 and 8 enrollment represented by each diocese, sorting in descending order, and cumulating the percentages. All dioceses up to and including the first diocese at or above the 80th cumulative percentage were defined as large dioceses. The remaining dioceses were defined as medium dioceses.
A simplified example is given below. The dioceses are ordered by descending percentage enrollment. The first six become large dioceses and the last six become medium dioceses.
Example showing assignment of Catholic dioceses to the large-size and medium-size diocese strata, private school grade 8 national assessment: 2022
-
Diocese
Percentage enrollment
Cumulative percentage enrollment
Stratum
Diocese 1
20
20
L
Diocese Percentage enrollment Cumulative percentage enrollment Stratum
-
Diocese 2
20
40
L
Diocese 3
15
55
L
Diocese 4
10
65
L
Diocese 5
10
75
L
Diocese 6
10
85
L
Diocese 7
5
90
M
Diocese 8
2
92
M
Diocese 9
2
94
M
Diocese 10
2
96
M
Diocese 11
2
98
M
Diocese 12
2
100
M
SOURCE: U.S. Department of Education, Institute of Education Sciences, National Center for Education Statistics, National Assessment of Educational Progress (NAEP), 2022 National Civics and U.S. History Assessments.
In actuality, there were 77 large and 96 medium dioceses in the sampling frame.
The target sample size was 10 dioceses total across the medium and large diocese strata: eight dioceses from the large-size diocese stratum and two from the medium-size diocese stratum.
In the medium-size diocese stratum, dioceses were selected with equal probability. In the large-size diocese stratum, dioceses were sampled with probability proportional to enrollment. These probabilities were retained and used in later stages of sampling and weighting of new schools.
NCEA was sent a listing of all the schools in the selected dioceses that appeared on the 2019–2020 PSS file and was asked to provide information about the new schools not included in the file and grade span changes of existing schools. These listings were used as sampling frames for selection of new Catholic schools and updates of existing schools.
The following table presents the number and percentage of schools and average estimated grade enrollment for the eighth-grade new-school frame by census region. There were no new schools in the Midwest region.
Eighth-grade new school frame for the private school national assessment: number and percentage of schools and estimated enrollment by census region: 2022
-
Census region
Schools
Percentage
Mean school size
Total
16
100.00
35
Northeast
11
68.75
39
Midwest
0
0.00
0
South
3
18.75
15
West
2
12.50
39
SOURCE: U.S. Department of Education, Institute of Education Sciences, National Center for Education Statistics, National Assessment of Educational Progress (NAEP), 2022 National Grade 8 Civics and U.S. History Assessments.
NAEP Technical Documentation School and Student Participation in the 2022 Eighth-Grade Private School National Assessment in Civics and U.S. History
The tables linked to the right present weighted school and student participation rates, student exclusion rates, and student full-time remote rates for the eighth-grade private school national civics and U.S. history samples.
A weighted school participation rate indicates the percentage of the student population that is directly represented by the participating school sample.
A weighted student participation rate indicates the percentage of the student population that is directly represented by the assessed students from within participating schools.
A weighted exclusion rate indicates the percentage of students in the population that would be excluded from the assessment. Students are generally excluded from a NAEP assessment if they have a disability or limited English language proficiency that prevents them from taking the assessment altogether or the accommodations they require to take the assessment were unavailable.
A weighted full-time remote rate indicates the percentage of the student population that is full-time remote.
Weighted School Response Rates
Weighted Student Response and Exclusion Rates for the Civics Assessment
Weighted Student Response and Exclusion Rates for the
U.S. History Assessment
Weighted school participation rates are calculated by dividing the sum of school base weights, weighted by student enrollment of the targeted grade, for all participating schools by the sum of the base weights, weighted by student enrollment of the target grade, for all eligible schools. Eligible schools are all sampled schools except those considered out- of-scope. The base weight is assigned to all sampled schools and is the inverse of the probability of selection. The weighted school participation rates in these tables reflect participation prior to substitution. That is, participating substitute schools that took the place of refusing originally sampled schools are not included in the numerator.
Weighted student participation rates are calculated by dividing the sum of the student base weights for all assessed students by the sum of the student base weights for all assessable students. (See below for the response dispositions of NAEP sampled students.) Students deemed assessable are those who were assessed or absent. They do not include students that were not eligible (primarily made up of withdrawn or graduated students) or students with disabilities (SD) or English learners (EL) who were excluded from the assessment.
Weighted student exclusion rates are calculated by dividing the sum of the school nonresponse-adjusted student base weights for all excluded students by the sum for all assessable and excluded students.
Weighted student full-time remote rates are calculated by dividing the sum of the school nonresponse-adjusted student base weights for all full-time remote students by the sum for all assessable, excluded, and full-time remote students.
Every student
sampled for
NAEP is
classified into
one of
the following
response disposition
categories:
![]() Assessed
Assessed
![]() Absent
Absent
![]() Excluded (must
be SD,
EL, or
SD and
EL)
Excluded (must
be SD,
EL, or
SD and
EL)
![]() Withdrawn or Graduated (ineligible)
Withdrawn or Graduated (ineligible)
![]() Full-time remote
Full-time remote
Assessed students were students that completed an assessment.
Absent students were students who were eligible to take an assessment but were absent from the initial session and the makeup session if one was offered. (Note, some schools, not all, had make-up sessions for students who were absent from the initial session.)
Excluded students were determined by their school to be unable to meaningfully take the NAEP assessment in their assigned subject, even with an accommodation. Excluded students must also be classified as SD and/or EL.
Withdrawn or graduated students are those who have left the school before the original assessment. These students are considered ineligible for NAEP. Full-time remote students are enrolled in brick-and-mortar schools but do not attend school in person. They are considered not assessable for NAEP.
NAEP Technical Documentation Weighted School Response Rates for the 2022 Eighth-Grade Private School National Assessment in Civics and U.S. History
The following table presents unweighted counts of eligible sampled and participating schools and weighted school response rates, by school type, for the eighth-grade private school national civics and U.S. history samples.
A weighted school response rate indicates the percentage of the student population that is directly represented by the participating school sample. These response rates are based on the original sample of schools (excluding substitutes).
Eligible and participating school counts and weighted school response rates for eighth-grade private schools, national civics and U.S. history assessments, by school type: 2022
-
School type
Number of eligible sampled schools
Number of participating schools
Weighted school response rate (percent)
All private
130
50
33.59
Catholic
40
30
61.74
Non-Catholic
100
20
15.03
NOTE: Detail may not sum to total due to rounding. Percentages are based on unrounded counts.
SOURCE: U.S. Department of Education, Institute of Education Sciences, National Center for Education Statistics, National Assessment of Educational Progress (NAEP), 2022 National Civics and U.S. History Assessments.
NAEP Technical Documentation Weighted Student Response and Exclusion Rates for the 2022 Eighth-Grade Private School National Civics Assessment
The following table presents weighted student response, exclusion, and full-time remote rates, by school type, for eighth-grade private school students in the national civics sample. Separate exclusion rates are provided for students with disabilities (SD) and English learners (EL).
A weighted student response rate indicates the percentage of the student population that is directly represented by the assessed students from within participating schools. A weighted exclusion rate indicates the percentage of students in the population that would be excluded from the assessment. The weighted student full-time remote rate indicates the percentage of the student population that is full-time remote (enrolled in brick-and-mortar schools but do not attend school in person).
Weighted student response, exclusion, and full-time remote rates for eighth-grade private schools, national civics assessment, by school type: 2022
-
School type
Weighted student response
rate (percent)
Weighted percentage of all students who were SD and excluded
Weighted percentage of all students who were EL and excluded
Weighted student full-time remote rates (percent)
All private
92.30
#
#
0.25
Catholic
91.89
#
#
#
Non-Catholic
93.55
#
#
0.41
# Rounds to zero.
SOURCE: U.S. Department of Education, Institute of Education Sciences, National Center for Education Statistics, National Assessment of Educational Progress (NAEP), 2022 Civics Assessment.
NAEP Technical Documentation Weighted Student Response and Exclusion Rates for the 2022 Eighth-Grade Private School National U.S. History Assessment
The following table presents weighted student response, exclusion, and full-time remote rates, by school type, for eighth-grade private school students in the national U.S. history sample. Separate exclusion rates are provided for students with disabilities (SD) and English learners (EL).
A weighted student response rate indicates the percentage of the student population that is directly represented by the assessed students from within participating schools. A weighted exclusion rate indicates the percentage of students in the population that would be excluded from the assessment. The weighted student full-time remote rate indicates the percentage of the student population that is full-time remote (enrolled in brick-and-mortar schools but do not attend school in person).
Weighted student response, exclusion, and full-time remote rates for eighth-grade private schools, national U.S. history assessment, by school type: 2022
-
School type
Weighted student response
rate (percent)
Weighted percentage of all students who were SD and excluded
Weighted percentage of all students who were EL and excluded
Weighted student full-time remote rates (percent)
All private
93.57
#
#
0.48
Catholic
94.26
#
#
#
Non-Catholic
91.51
#
#
0.80
# Rounds to zero.
SOURCE: U.S. Department of Education, Institute of Education Sciences, National Center for Education Statistics, National Assessment of Educational Progress (NAEP), 2022 U.S. History Assessment.
NAEP Technical Documentation School Sample Selection for the 2022 Eighth- Grade Private School National Assessment in Civics and U.S. History
The sampled schools for the eighth-grade private school national assessments in civics and U.S. history came from two frames: the primary private school sample frame constructed from the Private School Universe Survey (PSS) file and the supplemental new-school sampling frame. Schools were sampled from each school frame with probability proportional to size using systematic sampling. Prior to sampling, schools in each frame were sorted by the appropriate implicit stratification variables in a serpentine order within each explicit sampling stratum. (For details on explicit and implicit strata used for these samples see the stratification page.) A school's measure of size was a complex function of the school's estimated grade enrollment. Only one hit was allowed for each school.
Schools from the PSS-based frame were sampled at a rate that would yield a national sample of 1,600 assessed students (800 each from the
Computation of Measures of Size
School Sample Sizes: Frame and New School
Catholic and non-Catholic school strata across both subjects). Catholic schools from the new-school frames were sampled at the same rate as those from the PSS-based frame.
NAEP Technical Documentation Computation of Measures of Size for the 2022 Eighth-Grade Private School National Assessment in Civics and U.S. History
In designing the eighth-grade private school civics and U.S. history assessment samples, five objectives underlie the process of determining the probability of selection for each school and the number of students to be sampled from each selected school:
![]() to meet
the target
student sample
size for
each grade;
to meet
the target
student sample
size for
each grade;
![]() to select an equal-probability sample of students;
to select an equal-probability sample of students;
![]() to limit the number of students selected from any one school;
to limit the number of students selected from any one school;
![]() to ensure
that the
sample within
a school
does not
include a
very high
percentage of
the students
in the
school, unless
all students
are included;
and
to ensure
that the
sample within
a school
does not
include a
very high
percentage of
the students
in the
school, unless
all students
are included;
and
![]() to reduce the sampling rate of small schools, in recognition
of the greater cost and burden per student of conducting assessments
in such schools.
to reduce the sampling rate of small schools, in recognition
of the greater cost and burden per student of conducting assessments
in such schools.
The goal in determining the school's measure of size is to optimize across the last four objectives in terms of maintaining the precision of estimates and the cost effectiveness of the sample design.
Therefore, to meet the target student sample size objective and achieve a reasonable compromise among the next other objectives, the following algorithm was used to assign a measure of size to each school based on its estimated grade enrollment as indicated on the sampling frame.
In the formula below, `x_{js}` is the estimated grade enrollment for stratum `j` and school `s`, `y_{j}` is the target within-school student sample size for stratum `j`, and
`z_{js}` is the within-school take-all student cutoff for stratum `j` to which school `s` belongs, and `P_{s}` is a primary sampling unit (PSU) weight associated with the private school universe (PSS) area sample.
For grade 8, the within-school target sample size (`y_{j}`) was 50 and take-all cutoff was 52. The preliminary measure of size (MOS) was calculated as follows:
\begin{equation} MOS_{js} =
P_{s} \times \left\{ \begin{array}{l} x_{js} & \text{if } z_{j} < x_{js} \\[2pt]
y_{j} & \text{if } 20 < x_{js} \leq{z_{j}} \\[2pt]
\left(\dfrac{y_j}{20}\right) \times x_{js} & \text{if } 5 < x_{js} \leq {20} \\
\dfrac{y_j}{4} & x_{js} \leq {5} \end{array}\right.
\end{equation}
The preliminary school measure of size was rescaled to create an expected number of hits by applying a multiplicative constant `b_{j}`, which varies by school type. It follows that the final measure of size, `E_{js}`, was defined as: \begin{equation}
E_{js}=min(b_{j}\times MOS_{js}, u_{j}),
\end{equation} where `u_{j}` is the maximum number of hits allowed. For the 2022 private schools sample, the limit was one hit.
One can choose a value of `b_{j}` such that the expected overall student sample yield matches the desired targets specified by the design, where the expected yield is calculated by summing the product of an individual school’s probability and its student sample yield across all schools in the frame.
The school's probability of selection `pi_{js}` was given by: \begin{equation}
\pi_{js}=min(E_{js},1).
\end{equation}
In addition, new and newly-eligible Catholic schools were sampled from the new-school frame. The assigned measures of size for these schools, \begin{equation} E_{js}=min(b_{j}\times MOS_{js}\times \pi_{djs}^{-1} , u_{j}),
\end{equation} used the `b_{j}` and `u_{j}` values from the main school sample for the grade and school type (i.e., the same sampling rates as for the main school sample). The variable `pi_{djs}` is the probability of selection of the diocese into the new-school diocese `d` sample.
In addition, an adjustment was made to the initial measures of size in an attempt to reduce school burden by minimizing the number of schools selected for the NAEP 2022 national civics and U.S. history assessment and the NAEP 2022 national reading and mathematics assessment in private schools. The NAEP sampling procedures used an adaptation of the Keyfitz process to compute conditional measures of size that, by design, minimized the overlap of schools selected for both assessments.
NAEP Technical Documentation School Sample Sizes: PSS-Based and New-School Sampling Frames for the 2022 Eighth-Grade Private School National Assessment in Civics and U.S. History
The following table presents the number of schools selected for the eighth-grade private school sample by sampling frame (Private School Universe Survey [PSS]-based and new-school) and private school affiliation.
Number of schools in the total, PSS-based and new-school samples, grade 8 private national assessment, by school type: 2022
-
School type
Total school sample
PSS-based school sample
New-school sample
All private
170
170
#
Catholic
40
40
#
Non-Catholic private
110
110
†
Unknown affiliation
30
30
†
# Rounds to zero.
† Not applicable.
NOTE: Numbers of schools are rounded to nearest ten. Detail may not sum to totals due to rounding.
SOURCE: U.S. Department of Education, Institute of Education Sciences, National Center for Education Statistics, National Assessment of Educational Progress (NAEP), 2022 National Civics and U.S. History Assessments.
NAEP Technical Documentation Stratification of Schools for the 2022 Eighth- Grade Private School National Assessment in Civics and U.S. History
The purpose of school stratification is to increase the efficiency and ensure the representativeness of school samples in terms of important school-level characteristics, such as geography (e.g., census region), urbanicity, and race/ethnicity composition. NAEP school sampling utilizes two types of stratification: explicit and implicit.
Explicit stratification partitions the sampling frame into mutually exclusive groupings called strata. The systematic samples selected from these strata are independent, meaning that each sample is selected with its own unique random start. Implicit stratification involves sorting the sampling frame, as opposed to grouping the frame. For NAEP, schools are sorted in serpentine fashion by key school characteristics within sampling strata and sampled systematically using this ordering. This type of stratification ensures the representativeness of the school samples with respect to the key school characteristics.
Explicit stratification for the NAEP 2022 private school samples was by private school type: Catholic, non-Catholic, and unknown affiliation. Private school affiliation was unknown for nonrespondents to the NCES Private School Universe Survey (PSS) for the past three cycles.
The implicit stratification of the schools involved four dimensions. Within each explicit stratum, the private schools were hierarchically sorted by census region, urbanicity status, race/ethnicity status, and estimated grade enrollment. The implicit stratification in this four-fold hierarchical stratification was achieved via a "serpentine sort".
Census region was used as the first level of implicit stratification for the NAEP 2022 private school sample. For Catholic and non-Catholic schools, all four census regions were used as strata. For schools with unknown affiliation, two strata based on census region were formed by combining the Northeast and Midwest into one stratum and the South and West into another.
The next level of stratification was an urbanicity classification based on urban-centric locale, as specified on the PSS. Within a census region-based stratum, urban-centric locale cells that were too small were collapsed. The criterion for adequacy was that the cell had to have an expected school sample size of at least six.
The urbanicity variable was equal to the original urban-centric locale if no collapsing was necessary to cover an inadequate original cell. If collapsing was necessary, the scheme was to first collapse within the four major strata (city, suburbs, town, and rural). For example, if the expected number of large city schools sampled was less than six, large city was collapsed with midsize city. If the collapsed cell was still inadequate, they were further collapsed with small city. If a major stratum cell (all three cells collapsed together) was still deficient, it was collapsed with a neighboring major stratum cell. For example, city would be collapsed with suburbs.
The last stage of stratification was a division of the geographic/urbanicity strata into race/ethnicity strata if the expected number of schools sampled was large enough (i.e., at least equal to 12). This was done by deciding first on the number of race/ethnicity strata and then dividing the geography/urbanicity stratum into that many pieces. The school frame was sorted by the percentage of students in each school who were Black, Hispanic, or American Indian/Alaska Native. The three racial/ethnic groups defining the race/ethnicity strata were those that have historically performed substantially lower on NAEP assessments than White students. The sorted list was then divided into pieces, with roughly an equal expected number of sampled schools in each piece.
Finally, schools were sorted within stratification cells by estimated grade enrollment.
NAEP Technical Documentation Student Sample Selection for the 2022 Eighth- Grade Private School National Assessment in Civics and U.S. History
The sampling of students for the private school assessments in civics and U.S. history at eighth grade involved two steps: (1) sampling of students in the targeted grade (eighth) from each sampled school, and (2) assignment of assessment subject (civics or U.S. history) to the sampled students.
Sampling Students within Sampled Schools
Within each sampled school, a sample of students was selected from a list of students in the targeted grade such that every student had an equal chance of selection. The student lists were submitted either electronically using a system known as E-filing or on paper. In E-filing for private schools, student lists are submitted one school at a time by school coordinators in Excel files. E-filing allows schools to easily submit student demographic data electronically with the student lists, easing the burden on field supervisors and school coordinators.
Schools that are unable to submit their student lists using the E-filing system provide hardcopy lists to NAEP field supervisors. In 2022, most eighth-grade private schools in the national assessment in civics and U.S. history provided hardcopy lists. About 76 percent of the participating schools submitted hardcopy lists while 24 percent of the participating schools E-filed.
In year-round multi-track schools, students in tracks scheduled to be on break on the assessment day were removed from the student lists prior to sampling. (Student base weights were adjusted to account for these students.)
The sampling process was very similar, regardless of list submission type. The sampling process was systematic (e.g., if the sampling rate was one-half, a random starting point of one or two was chosen, and every other student on the list was selected). For E-filed schools only, where demographic data was submitted for every student in the school, students were sorted by gender and race/ethnicity before the sample was selected to implicitly stratify the sample.
In schools with up to 52 students in the targeted grade, all students were selected. In schools with more than 52 students, systematic samples of 50 students were selected. Some students enrolled in the school after the sample was selected. In such cases, new enrollees were sampled at the same rate as the students on the original list.
Assigning Assessment Subject to Sampled Students
Sampled students, including new enrollees, in each participating sampled school were assigned to either the civics or U.S. history assessment at rates of 49 percent and 51 percent, respectively, using a process known as spiraling. In this process, test forms were randomly assigned to sampled students from test form sets that had, on average, a ratio of 26 civics forms to 26 U.S. history forms. Students receiving a civics form were in the civics assessment, and students receiving a U.S. history form were in the U.S. history assessment.
NAEP Technical Documentation Substitute Schools for the 2022 Eighth-Grade Private School National Assessment in Civics and U.S. History
Though efforts were made to secure the participation of all schools selected, it was anticipated that not all schools would choose to participate. NAEP uses school substitution to mitigate the effect of bias due to nonresponse. A nonparticipating sampled school is replaced by its substitute when the original school is considered a final refusal.
For the eighth-grade private school national sample, substitute schools were preselected for all sampled schools with known affiliation from the Private School Universe Survey (PSS)-based frame by sorting the school frame file according to the actual order used in sample selection (the implicit stratification). Sampled schools with unknown affiliation were not assigned substitutes.
Schools were disqualified as potential substitutes if they were already selected in the private school sample or assigned as a substitute for another private school (earlier in the sort ordering).
The two candidates for substitutes were then the two nearest neighbors of the originally sampled school in the frame sort order. To be eligible as a potential substitute, the neighbor needed to be a nonsampled school (for any grade), and within the same explicit sampling stratum and of the same affiliation as the originally sampled school. If both nearest neighbors were eligible to be substitutes, the one with a closer grade enrollment was chosen. If both nearest neighbors had the same grade enrollment (an uncommon occurrence), one of the two was randomly selected.
In the eighth-grade private school sample, seven substitute schools ultimately participated.
NAEP Technical Documentation Target Population for the 2022 Eighth-Grade Private School National Assessment in Civics and U.S. History
The target populations for the 2022 eighth-grade private school national assessment in civics and U.S. history were defined as all eighth-grade students who were enrolled in private schools located within the 50 states and the District of Columbia.
NAEP Technical Documentation 2022 Eighth-Grade Public School National Assessment in Civics and U.S. History
The eighth-grade public school samples for the national assessments in civics and U.S. history were designed to produce nationally representative samples of students enrolled in grade eight in public schools in the United States. The target sample sizes of assessed students for the eighth-grade public school samples was 14,400 (7,200 per subject). Prior to sampling, the target sample sizes were adjusted upward to offset expected school and student attrition due to nonresponse and ineligibility.
Samples were selected using a two-stage probability-based design that involved selection of schools from within strata and selection of students within schools. The first-stage sample of schools was selected with probability proportional to a measure of size based on estimated grade-specific enrollment in the schools.
The sampling of students at the second-stage involved two steps: (1) sampling of students in the targeted grade (eighth) from each sampled school, and (2) assignment of assessment subject (civics or U.S. history) to the sampled students.
Target Population Sampling Frame Stratification of Schools School Sample Selection Substitute Schools Ineligible Schools Student Sample Selection
School and Student Participation
NAEP Technical Documentation Ineligible Schools for the 2022
Eighth-Grade Public School National Assessment in Civics and U.S. History
The Common Core of Data (CCD)-based public school frame, from which most of the sampled schools were drawn, corresponds to the 2019–2020 school year, two years prior to the assessment school year. During the intervening period, some of these schools either closed, no longer offered the grade of interest, or were ineligible for other reasons. In such cases, the sampled school was coded as ineligible.
Total and Eligible Schools Sampled Eligibility Status of Schools Sampled
NAEP Technical Documentation Eligibility Status of Schools Sampled for the 2022 Eighth-Grade Public School National Assessment in Civics and U.S. History
The following table shows the unweighted counts and percentages of sampled schools that were eligible and ineligible, by reason for ineligibility, for the eighth-grade public school sample for the national assessments in civics and U.S. history.
Sampled public schools, eighth-grade national assessment, by eligibility status: 2022
-
Eligibility status
Unweighted count of schools
Unweighted percentage
All sampled public schools
400
100.00
Eligible
390
96.51
Ineligible
14
3.49
Has sampled grade, but no eligible students
0
0.00
Does not have sampled grade
5
1.25
Closed
3
0.75
Not a regular school
6
1.50
Duplicate on sampling frame
0
0.00
Other ineligible
0
0.00
NOTE: Numbers of schools are rounded to nearest ten, except those pertaining to ineligible schools. Detail may not sum to total due to rounding. Percentages are based on unrounded counts.
SOURCE: U.S. Department of Education, Institute of Education Sciences, National Center for Education Statistics, National Assessment of Educational Progress (NAEP), 2022 National Civics and U.S. History Assessments.
NAEP Technical Documentation Total and Eligible Sampled Schools for the 2022 Eighth-Grade Public School National Assessment in Civics and U.S. History
The following table presents unweighted counts and percentages of ineligible and eligible schools by census region in the eighth-grade public school sample for the national assessments in civics and U.S. history.
Eligibility status of sampled public schools, eighth-grade national assessment, by census region: 2022
-
Census region
Eligibility status
Unweighted count
Unweighted percentage
Total
Total
400
100.00
NOTE: Numbers of schools are rounded to nearest ten. Detail may not sum to total due to rounding. Percentages are based on unrounded counts.
SOURCE: U.S. Department of Education, Institute of Education Sciences, National Center for Education Statistics, National Assessment of Educational Progress (NAEP), 2022 National Civics and U.S. History Assessments.
Census region Eligibility status Unweighted count Unweighted percentage
-
Ineligible
10
3.49
Eligible
390
96.51
Northeast
Total
60
100.00
Ineligible
0
5.45
Eligible
50
94.55
Midwest
Total
70
100.00
Ineligible
0
1.41
Eligible
70
98.59
South
Total
170
100.00
Ineligible
0
2.35
Eligible
170
97.65
West
Total
110
100.00
Ineligible
10
5.71
Eligible
100
94.29
NOTE: Numbers of schools are rounded to nearest ten. Detail may not sum to total due to rounding. Percentages are based on unrounded counts.
SOURCE: U.S. Department of Education, Institute of Education Sciences, National Center for Education Statistics, National Assessment of Educational Progress (NAEP), 2022 National Civics and U.S. History Assessments.
NAEP Technical Documentation Sampling Frame for the 2022 Eighth-Grade Public School National Assessment in Civics and U.S. History
The primary sampling frame for the 2022 eighth-grade public school samples for the civics and U.S. history assessments was developed from the Common Core of Data (CCD) file corresponding to the 2019–2020 school year. The CCD file is the Department of Education’s primary database of public elementary and secondary schools in the United States including U.S. territories. It includes all regular public, state-operated public, Bureau of Indian Education (BIE), and Department of Defense Education Activity (DoDEA) schools open during the 2019–2020 school year. This eighth-grade sampling frame is referred to as the CCD-based sampling frame.
Eighth-Grade Schools and Enrollment
New-School Sampling Frame
A secondary sampling frame was also created for these samples to account for schools that newly opened or became newly eligible between the 2019–2020 and 2021–2022 school years. This frame contains brand-new and newly-eligible eighth-grade schools and is referred to as the new-school sampling frame.
Both sampling frames excluded ungraded schools, vocational schools with no enrollment, special education-only schools, prison and hospital schools, home school entities, virtual or online schools, adult and evening schools, and juvenile correctional institutions. Vocational schools with no enrollment serve students who split their time between the vocational school and their home school.
NAEP Technical Documentation Eighth-Grade Schools and Enrollment in the 2022 Public School Civics and U.S. History Sampling Frame
The following table presents the number of eighth-grade public schools and its estimated enrollment, as contained in the Common Core of Data (CCD)-based sampling frame, by census region, for the national assessments in civics and U.S. history.
Number of schools and estimated enrollment in CCD-based eighth-grade public school sampling frame, national assessment, by census region: 2022
-
Census region
Schools
Percent
Estimated enrollment
Percent
Total
29,272
100.00
3,844,110
100.00
Northeast
4,538
15.50
587,506
15.28
Midwest
7,843
26.79
789,395
20.54
South
9,594
32.78
1,526,006
39.70
West
7,297
24.93
941,203
24.48
SOURCE: U.S. Department of Education, Institute of Education Sciences, National Center for Education Statistics, National Assessment of Educational Progress (NAEP), 2022 National Civics and U.S. History Assessments.
NAEP Technical Documentation New-School Sampling Frame for the 2022 Eighth- Grade Public School National Assessment in Civics and U.S. History
The primary sampling frame for the 2022 eighth-grade public school sample for the national assessments in civics and U.S. history was constructed using the most current Common Core of Data (CCD) file available from NCES. This file contained schools that were in existence during the 2019–2020 school year (i.e., it was two years out of date). During the subsequent 2-year period, undoubtedly some schools closed, some changed structure (one school becoming two schools, for example), some newly opened, and still others changed their grade span.
A supplemental sample was selected from a list of schools that were new or had become newly eligible sometime after the 2019–2020 school year. The goal was to allow every new school a chance of selection, thereby fully covering the target population of schools in operation during the 2021–2022 school year. It was infeasible to ask every school district in the United States to provide a supplemental school frame, so a two-stage procedure was employed. First, a sample of school districts was selected within each state. Then each State or Trial Urban District Assessment (TUDA) Coordinator was sent a list of the schools within their sampled districts that had been present on the 2019–2020 CCD file. The Coordinators were asked to add in any new schools and update grade span for the schools on this list.
The new-school process began with the preparation of a district-level frame. The starting point was a file containing every public school district in the United States. Specific districts were designated as in sample with certainty. They included the following districts:
![]() districts in
jurisdictions where
all schools
were selected
for sample
at either
grade 4
or 8;
districts in
jurisdictions where
all schools
were selected
for sample
at either
grade 4
or 8;
![]() state-operated districts;
state-operated districts;
![]() districts in states with fewer than 10 districts;
districts in states with fewer than 10 districts;
![]() charter-only districts
(that is,
districts containing
no schools
other than
charter schools);
and
charter-only districts
(that is,
districts containing
no schools
other than
charter schools);
and
![]() TUDA districts.
TUDA districts.
Then noncertainty districts were classified as small, medium, or large based on the number of schools and student enrollment of schools from the CCD-based public school frame.
A district was considered to be small if it contained no more than one school at each targeted grade (4 or 8). During school recruitment, the Coordinators were asked to identify schools within their district that newly offered the targeted grade. Every identified new school was added to the sample. From a sampling perspective, the new school was viewed as an “annex” to the sampled school which meant that it had a well-defined probability of selection equal to that of the sampled school. When a school in a small district was sampled from the CCD-based frame, its associated new school was automatically sampled as well.
Within each jurisdiction, districts that were neither certainty selections nor small were divided into two strata, one containing large-size districts and a second containing medium-size districts. These strata were defined by computing the percentage of jurisdiction grade 4 and 8 enrollment represented by each district, sorting in descending order, and cumulating the percentages. All districts up to and including the first district at or above the 80th cumulative percentage were defined as large districts. The remaining districts were defined as medium districts.
A simplified example is given below. The state's districts are ordered by descending percentage enrollment. The first six become large districts and the last six become medium districts.
Large-size and medium-size district strata example, by enrollment, stratum, and district, 2022
-
District
Percentage enrollment
Cumulative percentage enrollment
Stratum
1
20
20
L
2
20
40
L
3
15
55
L
4
10
65
L
5
10
75
L
6
10
85
L
7
5
90
M
8
2
92
M
9
2
94
M
10
2
96
M
District Percentage enrollment Cumulative percentage enrollment Stratum
-
11
2
98
M
12
2
100
M
SOURCE: U.S. Department of Education, Institute of Education Sciences, National Center for Education Statistics, National Assessment of Educational Progress (NAEP), 2022 National Grade 8 Civics and U.S. History Assessments.
The target sample size for each jurisdiction was 10 districts total across the medium-size and large-size district strata. Where possible, eight districts were selected from the large-size district stratum and two districts from the medium-size district stratum. However, in the example above, since there are only six large districts, all of the districts in the large district stratum and four districts from the medium district stratum would have been selected for the new-school inquiry.
If sampling was needed in the medium-size district stratum, districts in this stratum were selected with equal probability. If sampling was needed in the large-size district stratum, the districts in this stratum were sampled with probability proportional to enrollment. These probabilities were retained and used in later stages of sampling and weighting of new schools.
The selected districts in each jurisdiction were then sent a listing of all their schools that appeared on the 2019–2020 CCD file and were asked to provide information about the new schools not included in the file and grade span changes of existing schools. These listings provided by the selected districts were used as sampling frames for selection of new public schools and updates of existing schools. This process was conducted through the NAEP State or TUDA Coordinator in each jurisdiction. The Coordinators were sent the information for all sampled districts in their respective states and were responsible for returning the completed updates.
The following table presents the number and percentage of schools and average estimated grade enrollment for the eighth-grade new-school frame by census region.
Eighth-grade new school frame for the public school national assessment: number and percentage of schools and estimated enrollment, by census region: 2022
-
Census region
Schools
Percentage
Mean school size
Total
340
100.00
57
Northeast
51
15.00
104
Midwest
68
20.00
36
South
159
46.76
51
West
62
18.24
54
NOTE: Detail may not sum to totals because of rounding.
SOURCE: U.S. Department of Education, Institute of Education Sciences, National Center for Education Statistics, National Assessment of Educational Progress (NAEP), 2022 National Grade 8 Civics and U.S. History Assessments.
NAEP Technical Documentation School and Student Participation in the 2022 Eighth-Grade Public School National Assessment in Civics and U.S. History
The tables linked to the right present weighted school and student participation rates, student exclusion rates, and student full-time remote rates for the eighth-grade public school national civics and U.S. history samples.
A weighted school participation rate indicates the percentage of the student population that is directly represented by the participating school sample.
A weighted student participation rate indicates the percentage of the student population that is directly represented by the assessed students from within participating schools.
A weighted exclusion rate indicates the percentage of students in the population that would be excluded from the assessment. Students
Weighted School Response Rates
Weighted Student Response and Exclusion Rates for Civics
Weighted Student Response and Exclusion Rates for U.S. History
are generally excluded from a NAEP assessment if they have a disability or limited English language proficiency that prevents them from taking the assessment altogether or the accommodations they require to take the assessment were unavailable.
A weighted full-time remote rate indicates the percentage of the student population that is full-time remote.
Weighted school participation rates are calculated by dividing the sum of school base weights, weighted by student enrollment of the targeted grade, for all participating schools by the sum of the base weights, weighted by student enrollment of the target grade, for all eligible schools. Eligible schools are all sampled schools except those considered out- of-scope. The base weight is assigned to all sampled schools and is the inverse of the probability of selection. The weighted school participation rates in these tables reflect participation prior to substitution. That is, participating substitute schools that took the place of refusing originally sampled schools are not included in the numerator.
Weighted student participation rates are calculated by dividing the sum of the student base weights for all assessed students by the sum of the student base weights for all assessable students. (See below for the response dispositions of NAEP sampled students.) Students deemed assessable are those who were assessed or absent. They do not include students that were not eligible (primarily made up of withdrawn or graduated students) or students with disabilities (SD) or English learners (EL) who were excluded from the assessment.
Weighted student exclusion rates are calculated by dividing the sum of the school nonresponse-adjusted student base weights for all excluded students by the sum for all assessable and excluded students.
Weighted student full-time remote rates are calculated by dividing the sum of the school nonresponse-adjusted student base weights for all full-time remote students by the sum for all assessable, excluded, and full-time remote students.
Every student
sampled for
NAEP is
classified into
one of
the following
response disposition
categories:
![]() Assessed
Assessed
![]() Absent
Absent
![]() Excluded (must
be SD,
EL, or
SD and
EL)
Excluded (must
be SD,
EL, or
SD and
EL)
![]() Withdrawn or Graduated (ineligible)
Withdrawn or Graduated (ineligible)
![]() Full-time remote
Full-time remote
Assessed students were students that completed an assessment.
Absent students were students who were eligible to take an assessment but were absent from the initial session and the makeup session if one was offered. (Note, some schools, not all, had make-up sessions for students who were absent from the initial session.)
Excluded students were determined by their school to be unable to meaningfully take the NAEP assessment in their assigned subject, even with an accommodation. Excluded students must also be classified as SD and/or EL.
Withdrawn or graduated students are those who have left the school before the original assessment. These students are considered ineligible for NAEP. Full-time remote students are enrolled in brick-and-mortar schools but do not attend school in person. They are considered not assessable for NAEP.
NAEP Technical Documentation Weighted School Response Rates for the 2022 Eighth-Grade Public School National Assessment in Civics and U.S. History
The following table presents unweighted counts of eligible sampled and participating schools and weighted school response rates, by census region, for the eighth-grade public school national civics and U.S. history samples.
A weighted school response rate indicates the percentage of the student population that is directly represented by the participating school sample. These response rates are based on the original sample of schools (excluding substitutes).
Eligible and participating school counts and weighted school response rates for eighth-grade public schools, national civics and U.S. history assessments, by census region: 2022
-
Census region
Number of eligible sampled schools
Number of participating schools
Weighted school response rate (percent)
National
390
360
91.00
Northeast
50
50
87.13
Midwest
70
70
91.59
South
170
160
96.50
West
100
80
83.29
NOTE: Numbers of schools are rounded to nearest ten. Detail may not sum to totals due to rounding.
SOURCE: U.S. Department of Education, Institute of Education Sciences, National Center for Education Statistics, National Assessment of Educational Progress (NAEP), 2022 National Civics and U.S. History Assessments.
NAEP Technical Documentation Weighted Student Response and Exclusion Rates for the 2022 Eighth-Grade Public School National Civics Assessment
The following table presents weighted student response, exclusion, and full-time remote rates, by census region, for eighth-grade public school students in the national civics sample. Separate exclusion rates are provided for students with disabilities (SD) and English learners (EL).
A weighted student response rate indicates the percentage of the student population that is directly represented by the assessed students from within participating schools. A weighted exclusion rate indicates the percentage of students in the population that would be excluded from the assessment. The weighted student full-time remote rate indicates the percentage of the student population that is full-time remote (enrolled in brick-and-mortar schools but do not attend school in person).
Weighted student response, exclusion, and full-time remote rates for eighth-grade public schools, national civics assessment, by census region: 2022
-
Census region
Weighted student response
rates (percent)
Weighted percentage of all students who were SD and excluded
Weighted percentage of all students who were EL and excluded
Weighted student full-time remote rates (percent)
National
89.96
1.16
0.60
1.30
Northeast
87.98
0.95
0.61
0.36
Midwest
91.13
1.04
0.49
0.77
South
90.52
1.21
0.48
1.54
West
88.98
1.31
0.90
1.97
SOURCE: U.S. Department of Education, Institute of Education Sciences, National Center for Education Statistics, National Assessment of Educational Progress (NAEP), 2022 Civics Assessment.
NAEP Technical Documentation Weighted Student Response and Exclusion Rates for the 2022 Eighth-Grade Public School National U.S. History Assessment
The following table presents weighted student response, exclusion, and full-time remote rates, by census region, for eighth-grade public school students in the national U.S. history sample. Separate exclusion rates are provided for students with disabilities (SD) and English learners (EL).
A weighted student response rate indicates the percentage of the student population that is directly represented by the assessed students from within participating schools. A weighted exclusion rate indicates the percentage of students in the population that would be excluded from the assessment. The weighted student full-time remote rate indicates the percentage of the student population that is full-time remote (enrolled in brick-and-mortar schools but do not attend school in person).
Weighted student response, exclusion, and full-time remote rates for eighth-grade public schools, national U.S. history assessment, by census region: 2022
-
Census region
Weighted student response
rates (percent)
Weighted percentage of all students who were SD and excluded
Weighted percentage of all students who were EL and excluded
Weighted student full-time remote rates (percent)
National
89.58
1.42
0.51
1.09
Northeast
88.37
1.33
0.58
0.64
Midwest
90.85
0.98
0.40
0.86
South
89.70
1.54
0.52
1.08
West
88.87
1.68
0.56
1.63
SOURCE: U.S. Department of Education, Institute of Education Sciences, National Center for Education Statistics, National Assessment of Educational Progress (NAEP), 2022 U.S. History Assessment.
NAEP Technical Documentation School Sample Selection for the 2022 Eighth- Grade Public School National Assessment in Civics and U.S. History
The sampled schools for the eighth-grade public school national assessments in civics and U.S. history came from two frames: the primary public school sample frame constructed from the Common Core of Data (CCD) and the supplemental new-school sample frame. Schools were sampled from each school frame with probability proportional to size using systematic sampling. Prior to sampling, schools in each frame were sorted by the appropriate implicit stratification variables in a serpentine order. (For details on the implicit stratification variables used for these samples see the stratification page.) A school's measure of size was a complex function of the school's estimated grade enrollment. Only one hit was allowed for each school.
Computation of Measures of Size
School Sample Sizes: CCD-Based and New School
Schools from the CCD-based frame were sampled at a rate that would yield a national sample of 14,400 assessed students across both subjects. Schools from the new-school frame were sampled at the same rate as those from the CCD-based frame.
NAEP Technical Documentation Computation of Measures of Size for the 2022 Eighth-Grade Public School National Assessment in Civics and U.S. History
In designing the eighth-grade public school civics and U.S. history assessment samples, six objectives underlie the process of determining the probability of selection for each school and the number of students to be sampled from each selected school:
![]() to meet the overall target student sample size;
to meet the overall target student sample size;
![]() to select
an equal-probability
sample of
students from
each explicit
sampling stratum;
to select
an equal-probability
sample of
students from
each explicit
sampling stratum;
![]() to limit the number of students selected from any one school;
to limit the number of students selected from any one school;
![]() to ensure
that the
sample within
a school
does not
include a
very high
percentage of
the students
in the
school, unless
all students
are included;
to ensure
that the
sample within
a school
does not
include a
very high
percentage of
the students
in the
school, unless
all students
are included;
![]() to reduce
the sampling
rate of
small schools,
in recognition
of the
greater cost
and burden
per student
of conducting
assessments in
such schools;
and
to reduce
the sampling
rate of
small schools,
in recognition
of the
greater cost
and burden
per student
of conducting
assessments in
such schools;
and
![]() to increase the number of Black, Hispanic, and
American Indian/Alaska Native (AI/AN) students in the sample.
to increase the number of Black, Hispanic, and
American Indian/Alaska Native (AI/AN) students in the sample.
The goal in determining the school's measure of size (MOS) is to optimize across the middle four objectives in terms of maintaining the precision of estimates and the cost effectiveness of the sample design.
Therefore, to meet the target student sample size objective and achieve a reasonable compromise among the next four objectives, the following algorithm was used to assign a measure of size to each school based on its estimated grade enrollment as indicated on the sampling frame.\begin{equation} MOS_{js} = \left\{\begin{array}{llll} x_{js} &
\text{if } z_{j} < x_{js} \\[2pt] y_{j} & \text{if } 20 < x_{js} \leq{z_{j}} \\ \biggl(\dfrac{y_j}{20}\biggr) \times x_{js} & \text{if } 5 < x_{js} \leq {20} \\ \dfrac{y_j}{4} & x_{js} \leq {5} \end{array}\right. \end{equation}
where \(x_{js}\) is the estimated grade 8 enrollment for school \(s\) in stratum \(j\), and \(y_{j}\) is the target within-school student sample size for stratum \(j\), and `z_{js}` is the within-school take-all student cutoff for stratum `j` to which school `s` belongs.
To increase the number of AI/AN students in the sample, the measures of size for schools with relatively high proportions of AI/AN students (5 percent or more and with at least 5 AI/AN students in grade 8) were quadrupled.
Likewise, to increase the number of Black and Hispanic students in the sample, the measures of size for schools with relatively high proportions of Black and Hispanic students (15 percent or more and with at least 10 Black or Hispanic students in grade 8) were doubled.
This approach is effective in increasing the sample sizes of AI/AN, Black, and Hispanic students without inducing undesirably large design effects on the sample, either overall, or for particular subgroups.
For schools with high proportions of AI/AN students, the preliminary measures of size were calculated as follows: \begin{equation} MOS_{js} = 4 \times \left\{ \begin{array}
{l} x_{js} & \text{if } z_{j} < x_{js} \\[2pt] y_{j} & \text{if } 20 < x_{js} \leq{z_{j}} \\ \biggl(\dfrac{y_j}{20}\biggr) \times x_{js} & \text{if } 5 < x_{js} \leq {20} \\
\dfrac{y_j}{4} & x_{js} \leq {5} \end{array}\right. \end{equation}
For schools with high proportions of Black and Hispanic students, the preliminary measures of size were calculated as follows: \begin{equation} MOS_{js} = 2 \times \left\{
\begin{array}{l} x_{js} & \text{if } z_{j} < x_{js} \\[2pt] y_{j} & \text{if } 20 < x_{js} \leq{z_{j}} \\ \biggl(\dfrac{y_j}{20}\biggr) \times x_{js} & \text{if } 5 < x_{js} \leq
{20} \\ \dfrac{y_j}{4} & x_{js} \leq {5} \end{array}\right. \end{equation}
For all other schools (those with low proportions of AI/AN and Black and Hispanic students), the preliminary measures of size were calculated as follows: \begin{equation} MOS_{js} = \left\{\begin{array}{llll} x_{js} & \text{if } z_{j} < x_{js} \\[2pt] y_{j} & \text{if } 20 < x_{js} \leq{z_{j}} \\ \biggl(\dfrac{y_j}{20}\biggr) \times x_{js} &
\text{if } 5 < x_{js} \leq {20} \\ \dfrac{y_j}{4} & x_{js} \leq {5} \end{array}\right. \end{equation} where \(x_{js}\) is the estimated grade 8 enrollment for school \(s\) in stratum \(j\), \(y_{j}\) is the target within-school student sample size for stratum \(j\), and `z_{js}` is the within-school take-all student cutoff for stratum `j` to which school `s` belongs.
For the eighth-grade public school sample, the target sample size was 50, and the take-all cutoff was 52.
The preliminary school measure of size is rescaled to create an expected number of hits by applying a multiplicative constant \(b_{j}\), which varies by stratum \(j\). One can choose a value of \(b_{j}\) such that the expected overall student sample yield matches the desired target specified by the design, where the expected yield is calculated by summing the product of an individual school's probability and its student yield across all schools in the frame.
It follows that the final measure of size, \(E_{js}\), was defined as: $$E_{js}=min(b_{j}\times MOS_{js},u_{j})$$ where \(u_{j}\) is the maximum number of hits allowed. For the 2022 eighth-grade public school sample, the limit was one hit.
The school's probability of selection, `\pi_{js}`, was given by:
\begin{equation}
\pi_{js}=min(E_{js},1).
\end{equation} In addition, new and newly-eligible schools were sampled from the new-school frame. The assigned measures of size for these schools,
$$E_{js}=min(b_{j}\times MOS_{js} \times \pi_{djs}^{-1},u_{j})$$ used the \(b_{j}\) and \(u_{j}\) values from the CCD-based school frame for stratum \(j\) (i.e., the same sampling rate as for the CCD-based school sample within each stratum). \(\pi_{djs}\) is the probability of selection of the district into the new-school district (\(d\)) sample.
In addition, an adjustment was made to the initial measures of size in an attempt to reduce school burden by minimizing the number of schools selected for both the NAEP 2022 national assessment and the NAEP 2022 state assessments in public schools. The NAEP sampling procedures used an adaptation of the Keyfitz process to compute conditional measures of size that, by design, minimized the overlap of schools selected for both assessments.
NAEP Technical Documentation School Sample Sizes: CCD-Based and New-School Sampling Frames for the 2022 Eighth-Grade Public School National Assessment in Civics and U.S. History
The following table presents the number of schools selected for the eighth-grade public school sample by sampling frame (Common Core of Data [CCD]-based and new- school) and census region.
Public school sample counts for the eighth-grade national assessments, by census region and sampling frame (CCD-based, new-school): 2022
-
Census region
Total school sample
CCD-based school sample
New-school sample
Census region Total school sample CCD-based school sample New-school sample
-
Total
400
400
10
Northeast
60
50
#
Midwest
70
70
#
South
170
170
#
West
110
110
#
# Rounds to zero.
NOTE: Numbers of schools are rounded to nearest ten. Detail may not sum to totals due to rounding. SOURCE: U.S. Department of Education, Institute of Education Sciences, National Center for Education Statistics, National Assessment of Educational Progress (NAEP), 2022 National Civics and U.S. History Assessments.
NAEP Technical Documentation Stratification of Schools for the 2022 Eighth- Grade Public School National Assessment in Civics and U.S. History
The purpose of school stratification is to increase the efficiency and ensure the representativeness of school samples in terms of important school-level characteristics, such as geography (e.g., census division), urbanicity, and race/ethnicity composition. NAEP school sampling utilizes two types of stratification: explicit and implicit.
Explicit stratification partitions the sampling frame into mutually exclusive groupings called strata. The systematic samples selected from these strata are independent, meaning that each sample is selected with its own unique random start.
Implicit stratification involves sorting the sampling frame, as opposed to grouping the frame. For NAEP, schools are sorted in serpentine fashion by key school characteristics within sampling strata and sampled systematically using this ordering. This type of stratification ensures the representativeness of the school samples with respect to the key school characteristics.
The sampling of public schools for the grade 8 assessments in civics and U.S. history did not involve any explicit stratification, but it involved six dimensions of implicit stratification. The frames were hierarchically sorted by the following in the order shown to create the implicit strata:
![]() American Indian/Alaska
Native (AI/AN)
composition;
American Indian/Alaska
Native (AI/AN)
composition;
![]() Census division;
Census division;
![]() urbanicity status;
urbanicity status;
![]() Black/Hispanic
composition;
Black/Hispanic
composition;
![]() school type
(public, Bureau
of Indian
Education (BIE),
Department of
Defense Education
Activity (DoDEA);
and
school type
(public, Bureau
of Indian
Education (BIE),
Department of
Defense Education
Activity (DoDEA);
and
![]() median income (except for California schools where achievement
data is used instead).
median income (except for California schools where achievement
data is used instead).
AI/AN Composition
For the eighth-grade civics and U.S. history assessments in the national public school sample, implied strata were created by first classifying schools on the sampling frame as either low AI/AN or high AI/AN based on the percentage of AI/AN students in the targeted grade (the cutoff was 5 percent AI/AN students). The use of AI/AN classification in this manner is part of an oversampling scheme to ensure sufficient numbers of AI/AN students are present in the student samples. Grouping high AI/AN schools together in a sampling stratum helps bring schools with relatively large numbers of AI/AN students into the school sample. In turn, schools with more AI/AN students improve the chance that sufficient numbers of AI/AN students are included in the student samples.
Census Division
Within each of the low and high AI/AN classifications, schools were further classified into groups based on census division. A census division-based grouping can consist of a single census division, a set of neighboring census divisions, or a part of an individual census division. When census divisions are combined to form implied sampling strata, it is done generally within census regions. Because there are so few high AI/AN schools, the census division grouping within the high AI/AN stratum consisted of several neighboring census divisions.
Within the low AI/AN stratum, each census division, except the Pacific Census Division, constituted a separate census division grouping. The Pacific Census Division was split into two parts: California in one part and Alaska, Hawaii, Oregon, and Washington in the other part. This was done purposely so that California could use achievement data as the last stratification variable instead of median income. See last paragraph for more detail.
Urbanicity Status
The urbanicity classification strata were derived from the NCES urban-centric locale variable from the Common Core of Data (CCD), which classifies schools based on location ([1] city, [2] suburb, [3] town, [4] rural) and proximity to urbanized areas. Urban-centric locale has 12 possible values.
The urbanicity classification cells were created by starting with the original 12 NCES urban-centric locale categories within each AI/AN classification-by-census division grouping. Any cell with an expected school sample size less than four was combined with a neighboring cell within the same census division grouping. Collapsing was first done among the subcategories within a location class. (For example, the subcategories for location class city are (1) large, (2) mid-size, and (3) small. If one of these subcategories was deficient then either 1 was collapsed with 2; 3 collapsed with 2; or 2 collapsed with the smaller of 1 or 3.) If the collapsed cell was still too small, all three subcategories within a location class were combined.
If a collapsed location class still had an expected school sample size less than four, then it was collapsed with a neighboring collapsed location class. That is, location class 1 would be collapsed with 2, or location class 3 would be collapsed with 4. If additional collapsing was necessary, all location classes were combined. No collapsing across census division strata was allowed or necessary.
The result of this was a set of sampling strata defined by AI/AN classification, census division strata, and urbanicity classification having expected school sample sizes of at least four schools.
No further implicit strata for High AI/AN schools were formed beyond urbanization classification.
Black/Hispanic Composition
Low AI/AN schools within the nested urbanicity classification strata were further stratified into Black/Hispanic classification strata. The first division was the classification of schools as either low Black/Hispanic schools or high Black/Hispanic schools based on the total percentage of Black and Hispanic students in the target grade (the cutoff was 15 percent total Black and Hispanic students). Within the high Black/Hispanic classification, the number of substrata was based on the expected school sample size.
![]() If the
expected school
sample size
of resultant
stratum was
less than
or equal
to 8.0,
then this
was the
final
urbanicity-Black/Hispanic
stratum;
If the
expected school
sample size
of resultant
stratum was
less than
or equal
to 8.0,
then this
was the
final
urbanicity-Black/Hispanic
stratum;
![]() if the expected sample size was greater than or equal to 8.0
and less than 12.0, there were two substrata;
if the expected sample size was greater than or equal to 8.0
and less than 12.0, there were two substrata;
![]() if the
expected sample
size was
greater than
or equal
to 12.0
and less
than 16.0,
there were
three substrata;
and
if the
expected sample
size was
greater than
or equal
to 12.0
and less
than 16.0,
there were
three substrata;
and
![]() if the expected sample size was greater than or equal to 16.0,
there were four substrata.
if the expected sample size was greater than or equal to 16.0,
there were four substrata.
The substrata were defined by total percentage of Black and Hispanic students, with the cutoffs for substrata defined by weighted percentiles (with the weight equal to expected hits for each school).
![]() For two substrata, the cutoff was the weighted median;
For two substrata, the cutoff was the weighted median;
![]() for three
substrata, the
weighted 33rd
and 67th
percentiles; and
for three
substrata, the
weighted 33rd
and 67th
percentiles; and
![]() for four substrata, the weighted median and quartiles.
for four substrata, the weighted median and quartiles.
For the low Black/Hispanic classification, there were six urbanicity strata that had a large enough expected school sample size, and these were split into groups of states. Two or three state groups were formed using adjacent states if possible, while maintaining an expected school sample size of at least four for each state group for each of these six urbanicity strata.
School Type
The next implicit stratification variable was school type. School type takes on values of public, BIE, and DoDEA.
Median Income/Achievement
The last implicit stratification variable was median income of the ZIP code area containing the school, except in California, where student achievement data was used. Schools in California contain more than 12 percent of the grade 8 students in the nation. Using achievement data provides a benefit. Achievement is a better sort variable than median income when ordering schools within a state because it is direct measure of student performance. However, when ordering schools across states, median income is better than achievement because states generally use different achievement measures while median income is a standard measure across states.
NAEP Technical Documentation Student Sample Selection for the 2022 Eighth- Grade Public School National Assessment in Civics and U.S. History
The sampling of students for the public school assessments in civics and U.S. history at eighth grade involved two steps: (1) sampling of students in the targeted grade (eighth) from each sampled school, and (2) assignment of assessment subject (civics or U.S. history) to the sampled students.
Sampling Students within Sampled Schools
Within each sampled school, a sample of students was selected from a list of students in the targeted grade such that every student had an equal chance of selection. The student lists were submitted either electronically using a system known as E-filing or on paper. In E-filing, student lists are submitted as Excel files by either school coordinators, NAEP State Coordinators, or NAEP TUDA Coordinators. The files can be submitted for one school at a time (known as single school E-file submission) or for an entire
jurisdiction at once (known as multiple school E-file submission). E-filing allows schools to easily submit student demographic data electronically with the student lists, easing the burden on field supervisors and school coordinators.
Schools that are unable to submit their student lists using the E-filing system provide hardcopy lists to NAEP field supervisors. In 2022, approximately 99 percent of the participating eighth-grade public schools in the national assessment in civics and U.S. history E-filed their student lists while approximately 1 percent of the participating schools submitted hardcopy lists.
In year-round multi-track schools, students in tracks scheduled to be on break on the assessment day were removed from the student lists prior to sampling. (Student base weights were adjusted to account for these students.)
The sampling process was very similar, regardless of list submission type. The sampling process was systematic (e.g., if the sampling rate was one-half, a random starting point of one or two was chosen, and every other student on the list was selected). For E-filed schools only, where demographic data was submitted for every student in the school, students were sorted by gender and race/ethnicity before the sample was selected to implicitly stratify the sample.
In schools with up to 52 students in the targeted grade, all students were selected. In schools with more than 52 students, systematic samples of 50 students were selected. Some students enrolled in the school after the sample was selected. In such cases, new enrollees were sampled at the same rate as the students on the original list.
Assigning Assessment Subject to Sampled Students
Sampled students, including new enrollees, in each participating sampled school were assigned to either the civics or U.S. history assessment at rates of 49 percent and 51 percent, respectively, using a process known as spiraling. In this process, test forms were randomly assigned to sampled students from test form sets that had, on average, a ratio of 26 civics forms to 26 U.S. history forms. Students receiving a civics form were in the civics assessment, and students receiving a U.S. history form were in the U.S. history assessment.
NAEP Technical Documentation Substitute Schools for the 2022 Eighth-Grade Public School National Assessment in Civics and U.S. History
Though efforts were made to secure the participation of all schools selected, it was anticipated that not all schools would choose to participate. NAEP uses school substitution to mitigate the effect of bias due to nonresponse. A nonparticipating sampled school is replaced by its substitute when the original school is considered a final refusal.
For the eighth-grade public school national sample, substitute schools were preselected for all sampled schools from the Common Core of Data (CCD)-based sampling frame by sorting the school frame file according to a sort order very close to that used in sample selection (the implicit stratification). The two exceptions to this were as follows: (1) estimated grade enrollment replaces median income (achievement) as the last sort variable, and (2) school type in the stratification hierarchy was crossed with state (rather than used alone). The first change guaranteed that the selected substitute would have a grade enrollment very close to that of the originally selected school. The second change guaranteed that any selected substitutes would be within the same state as the originally sampled nonresponding school.
Schools were disqualified as potential substitutes if they were already selected in the public school sample or assigned as a substitute for another public school (earlier in the sort ordering).
The two candidates for substitutes were then the two nearest neighbors of the originally sampled school in this revised sort order. To be eligible as a potential substitute, the neighbor needed to be a nonsampled school (for any grade) and within the same explicit sampling stratum. If both nearest neighbors were eligible to be substitutes, the one with a closer grade enrollment was chosen. If both nearest neighbors had the same grade enrollment (an uncommon occurrence), one of the two was randomly selected.
In the eighth-grade public school sample, seven substitute schools ultimately participated.
NAEP Technical Documentation Target Population for the 2022 Eighth-Grade Public School National Assessment in Civics and U.S. History
The target population for the 2022 eighth-grade public school national assessments in civics and U.S. history was defined as all eighth-grade students who were enrolled in public schools, Bureau of Indian Education (BIE) schools, and Department of Defense Education Activity (DoDEA) schools located within the 50 states and the District of Columbia.
NAEP Technical Documentation 2022 Fourth- and Eighth-Grade Private School National Assessment in Mathematics and Reading
The fourth- and eighth-grade private school samples for the national mathematics and reading assessments were designed to produce nationally representative samples of students enrolled in fourth and eighth grade in private schools in the United States.
The target sample sizes of assessed students for each grade and subject are shown in the table below. Prior to sampling, these target sample sizes were adjusted upward to offset expected school and student attrition due to nonresponse and ineligibility.
Samples were selected using a two-stage probability design that involved selection of schools within strata and selection of students within schools. The first-stage samples of schools were selected with probability proportional to a measure of size based on the estimated grade-specific enrollment in the schools.
Target Population Sampling Frame Stratification of Schools School Sample Selection Substitute Schools
The sampling of students at the second-stage involved two steps: (1) sampling of students in the targeted grade (fourth or eighth) from each sampled school, and (2) assignment of assessment subject (mathematics or reading) to the sampled students.
Target sample sizes of assessed students, private school national assessment, by subject and grade: 2022
Ineligible Schools Student Sample Selection
School and Student Participation
-
Grade
Total
Mathematics
Reading
Total
9,400
4,700
4,700
4
4,700
2,350
2,350
8
4,700
2,350
2,350
SOURCE: U.S. Department of Education, Institute of Education Sciences, National Center for Education Statistics, National Assessment of
Educational Progress (NAEP), 2022 National Mathematics and Reading Assessments.
NAEP Technical Documentation Ineligible Schools for the 2022 Fourth- and Eighth-Grade Private School National Assessment in Mathematics and Reading
The Private School Universe Survey (PSS)-based private school frames, from which most of the sampled schools were drawn, correspond to the 2019–2020 school year, two years prior to the assessment school year. During the intervening period, some of these schools either closed, no longer offered the grade of interest, or were ineligible for other reasons. In such cases, the sampled schools were coded as ineligible.
Total and Eligible Schools Sampled
Eligibility Status of Schools Sampled
NAEP Technical Documentation Eligibility Status of Schools Sampled for the 2022 Fourth- and Eighth-Grade Private School National Assessment in Mathematics and Reading
The following table shows the unweighted counts and percentages of sampled schools that were eligible and ineligible, by reason for ineligibility, for the fourth- and eighth- grade private school national mathematics and reading samples.
Sampled private schools, national assessment, by grade and eligibility status: 2022
-
Grade and eligibility status
Unweighted count of schools
Unweighted percentage
All fourth-grade sampled private schools
390
100.00
Eligible
340
86.29
Ineligible
54
13.71
Has sampled grade, but no eligible students
5
1.27
Does not have sampled grade
8
2.03
Closed
19
4.82
Not a regular school
19
4.82
Duplicate on sampling frame
2
0.51
Other ineligible school
1
0.25
All eighth-grade sampled private schools
380
100.00
Eligible
330
86.95
Ineligible
50
13.05
Has sampled grade, but no eligible students
4
1.04
Does not have sampled grade
7
1.83
Closed
19
4.96
Not a regular school
20
5.22
Duplicate on sampling frame
0
0.00
Other ineligible school
0
0.00
NOTE: Numbers of schools are rounded to nearest ten, except those pertaining to ineligible schools. Detail may not sum to totals due to rounding. Percentages are based on unrounded counts.
SOURCE: U.S. Department of Education, Institute of Education Sciences, National Center for Education Statistics, National Assessment of Educational Progress (NAEP), 2022 National Mathematics and Reading Assessments.
NAEP Technical Documentation Total and Eligible Sampled Schools for the 2022 Fourth- and Eighth-Grade Private School National Assessment in Mathematics and Reading
The following table presents unweighted counts and percentages of ineligible and eligible schools by private school affiliation in the fourth- and eighth-grade private school national mathematics and reading samples. Schools whose private school affiliation was unknown at the time of sampling subsequently had their affiliation determined during
data collection. Therefore, such schools are not broken out separately and not included in the following table.
Eligibility status of sampled private schools, national assessment, by grade and private school type: 2022
-
Fourth grade
Eighth grade
Private school type
Eligibility status
Unweighted count
Unweighted percentage
Unweighted count
Unweighted percentage
All private
Total
370
100.00
360
100.00
Ineligible
40
11.11
30
9.22
Eligible
330
88.89
330
90.78
Catholic
Total
120
100.00
110
100.00
Ineligible
10
5.08
10
5.56
Eligible
110
94.92
100
94.44
Non-Catholic
Total
250
100.00
250
100.00
Ineligible
40
13.94
30
10.80
Eligible
220
86.06
220
89.20
NOTE: Numbers of schools are rounded to nearest ten. Detail may not sum to totals due to rounding. Percentages are based on unrounded counts.
SOURCE: U.S. Department of Education, Institute of Education Sciences, National Center for Education Statistics, National Assessment of Educational Progress (NAEP), 2022 National Mathematics and Reading Assessments.
NAEP Technical Documentation Sampling Frame for the 2022 Fourth- and Eighth- Grade Private School National Assessment in Mathematics and Reading
The primary sampling frames for the 2022 fourth- and eighth-grade private school samples for the national mathematics and reading assessments were developed from the Private School Universe Survey (PSS) corresponding to the 2019–2020 school year. The PSS file is the Department of Education’s primary database of elementary and secondary private schools in the 50 states and the District of Columbia, and it is based on a survey conducted by the U.S. Census Bureau during the 2019–2020 school year. These sampling frames are referred to as the PSS-based sampling frames.
Nonrespondents to the PSS were also included in the primary sampling frames. Since these schools did not respond to the
Fourth- and Eighth-Grade Schools and Enrollment
New-School Sampling Frame
PSS, their private school affiliation are unknown. Because NAEP response rates differ vastly by affiliation, to better estimate the target sample size of schools for each affiliation, additional work was done to obtain affiliation for these PSS nonrespondents. If a nonresponding school responded to a previous PSS (either two or four years prior), affiliation was obtained from the previous response. For those schools that were nonrespondents for the last three cycles of the PSS, in some cases internet research was used to establish affiliation. There were still schools with unknown affiliation remaining after this process.
A secondary set of sampling frames were also created for these samples to account for schools that newly opened or became newly eligible between the 2019–2020 and 2021– 2022 school years. These frames contain brand-new and newly-eligible fourth- and eighth-grade schools and are referred to as the new-school sampling frames. Because there are no sources available to identify new schools for non-Catholic private schools, the new school frame for private schools contains only Catholic schools.
Both sets of sampling frames excluded schools that were ungraded, provided only special education, were part of hospital or treatment center programs, were juvenile correctional institutions, were home-school entities, or were for adult education.
NAEP Technical Documentation Fourth- and Eighth-Grade Schools and Enrollment in the 2022 Private School Mathematics and Reading Sampling Frame
The following table presents the number of fourth- and eighth-grade private schools and their estimated enrollment as contained in the Private School Universe Survey (PSS)- based sampling frames, by private school affiliation, for the national mathematics and reading assessments. Grade-specific enrollment was estimated for each school as the average grade enrollment for grades 1 through 8.
The counts in this table are for schools with known affiliation. Schools with unknown affiliation do not appear in the table because their grade span, affiliation, and enrollment were unknown. Although PSS is a school universe survey, participation is voluntary and not all private schools respond. Since the NAEP sample must represent all private schools, not just PSS respondents, a small sample of PSS nonrespondents with unknown affiliation was selected for each of the targeted grades to improve NAEP coverage.
Number of schools and enrollment in private school sampling frame, national assessment, by grade and affiliation: 2022
-
Grade
Affiliation
Number of schools
Estimated enrollment
4
Total
18,352
320,372
Catholic
4,808
122,653
Non-Catholic
13,544
197,719
8
Total
16,894
317,439
Catholic
4,451
124,017
Non-Catholic
12,443
193,422
SOURCE: U.S. Department of Education, Institute of Education Sciences, National Center for Education Statistics, National Assessment of Educational Progress (NAEP), 2022 National Mathematics and Reading Assessments.
NAEP Technical Documentation New-School Sampling Frame for the 2022 Fourth- and Eighth-Grade Private School National Assessment in Mathematics and Reading
The NAEP 2022 private school frame was constructed using the most current Private School Universe Survey (PSS) file available from NCES. This file contained schools that were in existence during the 2019–2020 school year (i.e., it was two years out of date). During the subsequent 2-year period, undoubtedly, some schools closed, some changed structure (one school becoming two schools, for example), some newly opened, and still others changed their grade span.
A supplemental sample was selected from a list of Catholic schools that were new or had become newly eligible sometime after the 2019–2020 school year. The goal was to allow every new Catholic school a chance of selection, thereby fully covering the target population of Catholic schools in operation during the 2021–2022 school year. It was infeasible to ask every Catholic diocese in the United States to provide a supplemental school frame, so a two-stage procedure was employed. First, a sample of dioceses was selected. Then the National Catholic Educational Association (NCEA) was sent a list of the schools within their sampled dioceses that had been present on the 2019–2020 PSS file. NCEA was asked to add in any new schools and update grade span for the schools on this list.
The new-school process began with the preparation of a diocese-level frame. The starting point was a file containing every Catholic diocese in the U.S. classified as small, medium, or large based on the number of schools and student enrollment of schools from the PSS private school frame.
A diocese was considered to be small if it contained no more than one school at each targeted grade (4 or 8). During school recruitment, schools sampled from small dioceses were asked to identify schools within their dioceses that newly offered the targeted grade. Every identified new school was added to the sample. From a sampling perspective, the new school was viewed as an "annex" to the sampled school, which meant that it had a well-defined probability of selection equal to that of the sampled school. When
a school in a small diocese was sampled from the PSS frame, its associated new school was automatically sampled as well.
Dioceses that were not small were further divided into two strata, one containing large-size dioceses and a second containing medium-size dioceses. These strata were defined by computing the percentage of grade 4 and 8 enrollment represented by each diocese, sorting in descending order, and cumulating the percentages. All dioceses up to
and including the first diocese at or above the 80th cumulative percentage were defined as large dioceses. The remaining dioceses were defined as medium dioceses.
A simplified example is given below. The dioceses are ordered by descending percentage enrollment. The first six become large dioceses and the last six become medium dioceses.
Example showing assignment of Catholic dioceses to the large-size and medium-size diocese strata, private school national mathematics and reading assessments: 2022
-
Diocese
Percentage enrollment
Cumulative percentage enrollment
Stratum
Diocese 1
20
20
L
Diocese 2
20
40
L
Diocese 3
15
55
L
Diocese 4
10
65
L
Diocese 5
10
75
L
Diocese 6
10
85
L
Diocese 7
5
90
M
Diocese Percentage enrollment Cumulative percentage enrollment Stratum
-
Diocese 8
2
92
M
Diocese 9
2
94
M
Diocese 10
2
96
M
Diocese 11
2
98
M
Diocese 12
2
100
M
SOURCE: U.S. Department of Education, Institute of Education Sciences, National Center for Education Statistics, National Assessment of Educational Progress (NAEP), 2022 National Mathematics and Reading Assessments.
In actuality, there were 77 large and 96 medium dioceses in the sampling frame.
The target sample size was 10 dioceses total across the medium-size and large-size diocese strata: eight from the large-size diocese stratum and two from the medium-size diocese stratum.
In the medium-size diocese stratum, dioceses were selected with equal probability. In the large-size diocese stratum, dioceses were sampled with probability proportional to enrollment. These probabilities were retained and used in later stages of sampling and weighting of new schools.
NCEA was sent a listing of all the schools in the selected dioceses that appeared on the 2019–2020 PSS file and was asked to provide information about the new schools not included in the file and grade span changes of existing schools. These listings were used as sampling frames for selection of new Catholic schools and updates of existing schools.
The following table presents the number and percentage of schools and average estimated grade enrollment for the fourth- and eighth-grade "new-school" frame by census region. There were no new schools in Midwest region.
Number and percentage of schools and mean school size in the new-school frame, national private assessment, by grade and census region: 2022
-
Census region
Grade 4
Grade 8
Schools
Percentage
Mean school
size
Schools
Percentage
Mean school
size
Total
14
100.00
35
16
100.00
35
Northeast
10
71.43
41
11
68.75
39
Midwest
0
0.00
0
0
0.00
0
South
3
21.43
15
3
18.75
15
West
1
7.14
35
2
12.50
39
NOTE: Detail may not sum to totals because of rounding.
SOURCE: U.S. Department of Education, Institute of Education Sciences, National Center for Education Statistics, National Assessment of Educational Progress (NAEP), 2022 National Mathematics and Reading Assessments.
NAEP Technical Documentation School and Student Participation in the 2022 Fourth- and Eighth-Grade Private School National Assessment in Mathematics and Reading
The tables linked to the right present weighted school and student participation rates, student exclusion rates, and student full-time remote rates for the fourth- and eighth-grade private school national mathematics and reading samples.
A weighted school participation rate indicates the percentage of the student population that is directly represented by the participating school sample.
A weighted student participation rate indicates the percentage of the student population that is directly represented by the assessed students from within participating schools.
A weighted exclusion rate indicates the percentage of students in the population that would be excluded from the assessment. Students are generally excluded from a NAEP assessment if they have a disability or limited English language proficiency that prevents them from taking the assessment altogether or the accommodations they require to take the assessment were unavailable.
A weighted full-time remote rate indicates the percentage of the student population that is full-time remote.
Weighted School Response Rates
Weighted Student Response and Exclusion Rates for Mathematics
Weighted Student Response and Exclusion Rates for Reading
Weighted school participation rates are calculated by dividing the sum of school base weights, weighted by student enrollment of the targeted grade, for all participating schools by the sum of the base weights, weighted by student enrollment of the target grade, for all eligible schools. Eligible schools are all sampled schools except those considered out- of-scope. The base weight is assigned to all sampled schools and is the inverse of the probability of selection. The weighted school participation rates in these tables reflect participation prior to substitution. That is, participating substitute schools that took the place of refusing originally sampled schools are not included in the numerator.
Weighted student participation rates are calculated by dividing the sum of the student base weights for all assessed students by the sum of the student base weights for all assessable students. (See below for the response dispositions of NAEP sampled students.) Students deemed assessable are those who were assessed or absent. They do not include students that were not eligible (primarily made up of withdrawn or graduated students) or students with disabilities (SD) or English learners (EL) students who were excluded from the assessment.
Weighted student exclusion rates are calculated by dividing the sum of the school nonresponse-adjusted student base weights for all excluded students by the sum for all assessable and excluded students.
Weighted student full-time remote rates are calculated by dividing the sum of the school nonresponse-adjusted student base weights for all full-time remote students by the sum for all assessable, excluded, and full-time remote students.
Every student
sampled for
NAEP is
classified into
one of
the following
response disposition
categories:
![]() Assessed
Assessed
![]() Absent
Absent
![]() Excluded (must be SD, EL, or SD and EL)
Excluded (must be SD, EL, or SD and EL)
![]() Withdrawn or
Graduated (ineligible)
Withdrawn or
Graduated (ineligible)
![]() Full-time remote
Full-time remote
Assessed students were students that completed an assessment.
Absent students were students who were eligible to take an assessment but were absent from the initial session and the makeup session if one was offered. (Note, some schools, not all, had make-up sessions for students who were absent from the initial session.)
Excluded students were determined by their school to be unable to meaningfully take the NAEP assessment in their assigned subject, even with an accommodation. Excluded students must also be classified as SD and/or EL.
Withdrawn or graduated students are those who have left the school before the original assessment. These students are considered ineligible for NAEP. Full-time remote students are enrolled in brick-and-mortar schools but do not attend school in person. They are considered not assessable for NAEP.
NAEP Technical Documentation Weighted School Response Rates for the 2022 Fourth- and Eighth-Grade Private School National Assessment in Mathematics and Reading
The following table presents unweighted counts of eligible sampled and participating schools and weighted school response rates, by school type, for the fourth- and eighth- grade private school national mathematics and reading samples.
A weighted school response rate indicates the percentage of the student population that is directly represented by the participating school sample. These response rates are based on the original sample of schools (excluding substitutes).
Eligible and participating school counts and weighted school response rates for fourth- and eighth-grade private schools, national mathematics and reading assessments, by school type: 2022
-
Grade
Private school type
Number of eligible sampled schools
Number of participating schools
Weighted school response rate (percent)
4
All private
340
150
37.50
NOTE: Detail may not sum to total due to rounding. Percentages are based on unrounded counts.
SOURCE: U.S. Department of Education, Institute of Education Sciences, National Center for Education Statistics, National Assessment of Educational Progress (NAEP), 2022 National Mathematics and Reading Assessments.
Grade Private school type Number of eligible sampled schools Number of participating schools Weighted school response rate (percent)
-
Catholic
110
90
66.61
Non-Catholic
230
60
20.01
8 All private
330
130
35.49
Catholic
100
80
60.98
Non-Catholic
230
60
19.80
NOTE: Detail may not sum to total due to rounding. Percentages are based on unrounded counts.
SOURCE: U.S. Department of Education, Institute of Education Sciences, National Center for Education Statistics, National Assessment of Educational Progress (NAEP), 2022 National Mathematics and Reading Assessments.
NAEP Technical Documentation Weighted Student Response and Exclusion Rates for the 2022 Fourth- and Eighth-Grade Private School National Mathematics Assessment
The following table presents weighted student response, exclusion, and full-time remote rates, by school type, for the fourth- and eighth-grade private school national mathematics samples. Separate exclusion rates are provided for students with disabilities (SD) and English learners (EL).
A weighted student response rate indicates the percentage of the student population that is directly represented by the assessed students from within participating schools. A weighted exclusion rate indicates the percentage of students in the population that would be excluded from the assessment. The weighted student full-time remote rate indicates the percentage of the student population that is full-time remote (enrolled in brick-and-mortar schools but do not attend school in person).
Weighted student response, exclusion, and full-time remote rates for private schools, national mathematics assessment, by grade and school type: 2022
-
Weighted student
Weighted percentage of
Weighted percentage of
Weighted student
Grade
Private school type
response rate
(percent)
all students who were SD and
excluded
all students who were EL and
excluded
full-time remote rates
(percent)
4
All private
93.71
0.40
0.08
0.29
Catholic
93.67
0.15
0.21
0.25
Non-Catholic Private
93.77
0.54
#
0.31
8
All private
93.97
#
#
0.63
# Rounds to zero.
SOURCE: U.S. Department of Education, Institute of Education Sciences, National Center for Education Statistics, National Assessment of Educational Progress (NAEP), 2022 Mathematics Assessment.
Grade Private school type
Weighted student response rate
(percent)
Weighted percentage of all students who were SD and
excluded
Weighted percentage of all students who were EL and
excluded
Weighted student full-time remote rates
(percent)
-
Catholic
94.09
#
#
0.28
Non-Catholic Private
93.74
#
#
0.85
# Rounds to zero.
SOURCE: U.S. Department of Education, Institute of Education Sciences, National Center for Education Statistics, National Assessment of Educational Progress (NAEP), 2022 Mathematics Assessment.
NAEP Technical Documentation Weighted Student Response and Exclusion Rates for the 2022 Fourth- and Eighth-Grade Private School National Reading Assessment
The following table presents weighted student response, exclusion, and full-time remote rates, by school type, for the fourth- and eighth-grade private school national reading samples. Separate exclusion rates are provided for students with disabilities (SD) and English learners (EL).
A weighted student response rate indicates the percentage of the student population that is directly represented by the assessed students from within participating schools. A weighted exclusion rate indicates the percentage of students in the population that would be excluded from the assessment. The weighted student full-time remote rate indicates the percentage of the student population that is full-time remote (enrolled in brick-and-mortar schools but do not attend school in person).
Weighted student response, exclusion, and full-time remote rates for private schools, national reading assessment, by gradae and school type: 2022
-
Weighted student
Weighted percentage of
Weighted percentage of
Weighted student
Grade
Private school type
response rate
(percent)
all students who were SD and
excluded
all students who were EL and
excluded
full-time remote rates
(percent)
4
All private
94.12
0.17
0.09
0.37
Catholic
95.19
0.16
0.23
0.41
Non-Catholic Private
92.19
0.17
#
0.34
8
All private
94.86
0.14
#
0.26
Catholic
95.42
#
#
#
# Rounds to zero.
SOURCE: U.S. Department of Education, Institute of Education Sciences, National Center for Education Statistics, National Assessment of Educational Progress (NAEP), 2022 Reading Assessment.
Grade Private school type
Weighted student response rate
(percent)
Weighted percentage of all students who were SD and
excluded
Weighted percentage of all students who were EL and
excluded
Weighted student full-time remote rates
(percent)
-
Non-Catholic Private
93.72
0.22
#
0.43
# Rounds to zero.
SOURCE: U.S. Department of Education, Institute of Education Sciences, National Center for Education Statistics, National Assessment of Educational Progress (NAEP), 2022 Reading Assessment.
NAEP Technical Documentation School Sample Selection for the 2022 Fourth- and Eighth-Grade Private School National Assessment in Mathematics and Reading
The sampled schools for the fourth- and eighth-grade private school national assessments in mathematics and reading came from two frames: the primary private school sample frame constructed from the Private School Universe Survey (PSS) file and the supplemental new- school sample frame. Schools were sampled from each school frame with probability proportional-to-size (PPS) using systematic sampling. Prior to sampling, schools in each frame were sorted by the appropriate implicit stratification variables in a serpentine order within each explicit sampling stratum. (For details on explicit and implicit strata used for these samples see the stratification page.) A school's measure of size was a complex function of the school's estimated grade enrollment. Only one hit was allowed for each school.
Computation of Measures of Size
School Sample Sizes: Frame and New School
Schools from the PSS-based frame were sampled at a rate that would yield a national sample of 4,700 assessed students (2,350 each from the Catholic and non-Catholic school strata) at grade 4 and at grade 8. Catholic schools from the new-school frames were sampled at the same rate as those from the PSS-based frames.
NAEP Technical Documentation Computation of Measures of Size for the 2022 Fourth- and Eighth-Grade Private School National Assessment in Mathematics and Reading
There were five objectives underlying the process for determining the probability of selection for each school and for setting the number of students to be sampled within each selected school:
![]() to meet
the target
student sample
size for
each grade;
to meet
the target
student sample
size for
each grade;
![]() to select an equal-probability sample of students;
to select an equal-probability sample of students;
![]() to limit the number of students selected from any one school;
to limit the number of students selected from any one school;
![]() to ensure
that the
sample within
a school
does not
include a
very high
percentage of
the students
in the
school, unless
all students
are included;
and
to ensure
that the
sample within
a school
does not
include a
very high
percentage of
the students
in the
school, unless
all students
are included;
and
![]() to reduce the sampling rate of small schools, in recognition
of the greater cost and burden per student of conducting assessments
in such schools.
to reduce the sampling rate of small schools, in recognition
of the greater cost and burden per student of conducting assessments
in such schools.
The goal in determining the school's measure of size is to optimize across the last four objectives in terms of maintaining the precision of estimates and the cost effectiveness of the sample design.
Therefore, to meet the target student sample size objective and achieve a reasonable compromise among the other four objectives, the following algorithm was used to assign a measure of size to each school based on its estimated grade enrollment as indicated on the sampling frame.
In the formula below, `x_{js}` is the estimated grade enrollment for stratum `j` and school `s`, `y_{j}` is the target within-school student sample size for stratum `j,` `z_{js}` is the within-school take-all student cutoff for stratum `j` to which school `s` belongs, and `P_{s}` is a primary sampling unit (PSU) weight associated with the private school universe (PSS) area sample.
For grades 4 and 8, the target within school sample size (`y_{j}`) was 50, and the take-all cut (`z_{js}`) was 52.
For the fourth- and eighth-grade national assessment in mathematics and reading for private schools, the preliminary measures of size (MOS) were calculated as follows:
\begin{equation}
MOS_{js} = P_{s}\times \left\{ \begin{array}{l} x_{js} & \text{if } z_{js} < x_{js} \\[2pt]
y_{j} & \text{if } 20 < x_{js} \leq{z_{js}} \\[2pt]
\left(\dfrac{y_j}{20}\right) \times x_{js} & \text{if } 5 < x_{js} \leq {20} \\
\dfrac{y_j}{4} & x_{js} \leq {5} \end{array}\right.
\end{equation}
The preliminary school measure of size is rescaled to create an expected number of hits by applying a multiplicative constant `b_{j}`, which varies by grade and school type. It follows that the final measure of size, `E_{js}`, was defined as:
\begin{equation}
E_{js}=min(b_{j}\times MOS_{js}, u_{j}),
\end{equation}
where `u_{j}` is the maximum number of hits allowed. For the fourth- and eighth-grade private school samples for the mathematics and reading assessments, the limit was one hit.
One can choose a value of `b_{j}` such that the expected overall student sample yield matches the desired targets specified by the design, where the expected yield is calculated by summing the product of an individual school’s probability and its student sample yield across all schools in the frame.
The school's probability of selection, `\pi_{js}`, was given by: \begin{equation}
\pi_{js}=min(E_{js},1).
\end{equation}
In addition, new and newly-eligible Catholic schools were sampled from the new-school frame. The assigned measures of size for these schools,
\begin{equation}
E_{js}=min(b_{j}\times MOS_{js}\times\pi_{djs}^{-1} , u_{j}),
\end{equation}
used the `b_{j}` and `u_{j}` values from the main school sample for the grade and school type (i.e., the same sampling rates as for the main school sample). The variable
`\pi_{djs}` is the probability of selection of the diocese into the new-school diocese (`d`) sample.
NAEP Technical Documentation School Sample Sizes: PSS-Based and New-School for the 2022 Fourth- and Eighth-Grade Private School National Assessment in Mathematics and Reading
The following table presents the number of schools selected for the fourth- and eighth-grade private school mathematics and reading samples by sampling frame (Private School Universe Survey [PSS]-based and new-school) and private school affiliation.
Number of schools in the total, PSS-based, and new-school samples, national private assessment, by grade and school type: 2022
-
Grade and private school type
Total school sample
PSS-based school sample
New-school sample
Grade 4
All private
390
390
#
Catholic
120
120
#
Non-Catholic
250
250
†
Unknown affiliation
30
30
†
Grade 8
All private
380
380
#
Catholic
110
110
#
Non-Catholic
250
250
†
# Rounds to zero.
† Not applicable.
NOTE: Numbers of schools are rounded to nearest ten. Detail may not sum to totals due to rounding.
SOURCE: U.S. Department of Education, Institute of Education Sciences, National Center for Education Statistics, National Assessment of Educational Progress (NAEP), 2022 National Mathematics and Reading Assessments.
Grade and private school type Total school sample PSS-based school sample New-school sample
-
Unknown affiliation
30
30
†
# Rounds to zero.
† Not applicable.
NOTE: Numbers of schools are rounded to nearest ten. Detail may not sum to totals due to rounding.
SOURCE: U.S. Department of Education, Institute of Education Sciences, National Center for Education Statistics, National Assessment of Educational Progress (NAEP), 2022 National Mathematics and Reading Assessments.
NAEP Technical Documentation Stratification of Schools for the 2022 Fourth- and Eighth-Grade Private School National Assessment in Mathematics and Reading
The purpose of school stratification is to increase the efficiency and ensure the representativeness of school samples in terms of important school-level characteristics, such as geography (e.g., census region), urbanicity, and race/ethnicity composition. NAEP school sampling utilizes two types of stratification: explicit and implicit.
Explicit stratification partitions the sampling frame into mutually exclusive groupings called strata. The systematic samples selected from these strata are independent, meaning that each sample is selected with its own unique random start. Implicit stratification involves sorting the sampling frame, as opposed to grouping the frame. For NAEP, schools are sorted in serpentine fashion by key school characteristics within sampling strata and sampled systematically using this ordering. This type of stratification ensures the representativeness of the school samples with respect to the key school characteristics.
Explicit stratification for the NAEP 2022 private school samples for mathematics and reading at grades 4 and 8 was by private school type: Catholic, non-Catholic, and unknown affiliation. Private school affiliation was unknown for schools that were nonrespondents to the NCES Private School Universe Survey (PSS) for the past three cycles.
The implicit stratification of the schools involved four dimensions. Within each explicit stratum, the private schools were hierarchically sorted by census region, urbanicity classification, race/ethnicity classification, and estimated grade enrollment. The implicit stratification in this four-fold hierarchical stratification was achieved via a "serpentine sort."
Census region was used as the first level of implicit stratification for the NAEP 2022 private school sample for mathematics and reading. All four census regions were used as strata.
The next level of stratification was an urbanicity classification based on urban-centric locale, as specified on the PSS. Within a census region-based stratum, urban-centric locale cells that were too small were collapsed. The criterion for adequacy was that the cell had to have an expected school sample size of at least six. The urbanicity variable was equal to the original urban-centric locale if no collapsing was necessary to cover an inadequate original cell. If collapsing was necessary, the scheme was to first collapse within the four major strata (city, suburbs, town, and rural). For example, if the expected number of large city schools sampled was less than six, large city was collapsed with midsize city. If the collapsed cell was still inadequate, they were further collapsed with small city. If a major stratum cell (all three cells collapsed together) was still deficient, it was collapsed with a neighboring major stratum cell. For example, city would be collapsed with suburbs.
The last stage of stratification was a division of the geographic/urbanicity strata into race/ethnicity strata if the expected number of schools sampled was large enough (i.e., at
least equal to 12). This was done by deciding first on the number of race/ethnicity strata and then dividing the geography/urbanicity stratum into that many pieces. The school frame was sorted by the percentage of students in each school who were Black, Hispanic, or American Indian/Alaska Native. The three racial/ethnic groups defining the race/ethnicity strata were those that have historically performed substantially lower on NAEP assessments than White students. The sorted list was then divided into pieces, with roughly an equal expected number of sampled schools in each piece.
Finally, schools were sorted within stratification cells by estimated grade enrollment.
NAEP Technical Documentation Student Sample Selection for the 2022 Fourth- and Eighth-Grade Private School National Assessment in Mathematics and Reading
The sampling of students for the fourth- and eighth-grade private school national assessments in mathematics and reading involved two steps: (1) sampling of students in the targeted grade (fourth or eighth) from each sampled school, and (2) assignment of assessment subject (mathematics or reading) to the sampled students.
Sampling Students within Sampled Schools
Within each sampled school, a sample of students was selected from a list of students in the targeted grade such that every student had an equal chance of selection. The student lists were submitted either electronically using a system known as E-filing or on paper. In E-filing for private schools, student lists are submitted one school at a time by school coordinators in Excel files. E-filing allows schools to easily submit student demographic data electronically with the student lists, easing the burden on field supervisors and school coordinators.
Schools that are unable to submit their student lists using the E-filing system provide hardcopy lists to NAEP field supervisors. In 2022, most private schools in the national assessments in mathematics and reading submitted hardcopy lists rather than electronic lists. At fourth grade, 72 percent of the participating schools submitted hardcopy lists and 28 percent submitted electronic lists. At eighth grade, 70 percent of the schools submitted hardcopy lists, and 30 percent submitted electronic lists.
In year-round multi-track schools, students in tracks scheduled to be on break on the assessment day were removed from the student lists prior to sampling. (Student base weights were adjusted to account for these students.)
The sampling process was very similar, regardless of list submission type. The sampling process was systematic (e.g., if the sampling rate was one-half, a random starting point of one or two was chosen, and every other student on the list was selected). For E-filed schools only, where demographic data was submitted for every student on the frame, students were sorted by gender and race/ethnicity before the sample was selected to implicitly stratify the sample.
In schools with up to 52 students in the targeted grade, all students were selected. In schools with more than 52 students, systematic samples of 50 students were selected. Some students enrolled in the school after the sample was selected. In such cases, new enrollees were sampled at the same rate as the students on the original list.
Assigning Assessment Subject to Sampled Students
Sampled students, including new enrollees, in each participating sampled school were assigned to either the mathematics or the reading assessment at rates of 52 percent and 48 percent, respectively for grade 4, or 50 percent for each subject for grade 8, using a process known as spiraling. In this process, test forms were randomly assigned to sampled students from test form sets that had, on average, a ratio of 26 mathematics forms to 24 reading forms for grade 4, and a ratio of 25 mathematics forms to 25 reading forms for grade 8. Students receiving a mathematics form were in the mathematics assessment, and students receiving a reading form were in the reading assessment.
NAEP Technical Documentation Substitute Schools for the 2022 Fourth- and Eighth-Grade Private School National Assessment in Mathematics and Reading
Though efforts were made to secure the participation of all schools selected, it was anticipated that not all schools would choose to participate. NAEP uses school substitution to mitigate the effect of bias due to nonresponse. A nonparticipating sampled school is replaced by its substitute when the original school is considered a final refusal.
For the fourth- and eighth-grade private school mathematics and reading samples, substitute schools were preselected for all sampled schools with known affiliation from the Private School Universe Survey (PSS)-based sampling frames by sorting the school frame files according to the actual order used in sample selection (the implicit stratification). Sampled schools with unknown affiliation were not assigned substitutes.
Schools were disqualified as potential substitutes if they were already selected in the private school sample or assigned as a substitute for another private school (earlier in the sort ordering).
The two candidates for substitutes were then the two nearest neighbors of the originally sampled school in the frame sort order. To be eligible as a potential substitute, the neighbor needed to be a nonsampled school (for any grade), and within the same explicit sampling stratum and of the same affiliation as the originally sampled school. If both nearest neighbors were eligible to be substitutes, the one with a closer grade enrollment was chosen. If both nearest neighbors had the same grade enrollment (an uncommon occurrence), one of the two was randomly selected.
In the fourth-grade private school mathematics and reading sample, 16 substitute schools ultimately participated. In the eighth-grade private school sample, 14 substitute schools participated.
NAEP Technical Documentation Target Population for the 2022 Fourth- and Eighth-Grade Private School National Assessment in Mathematics and Reading
The target populations for the 2022 fourth- and eighth-grade private school national assessments in mathematics and reading were defined as all fourth- and eighth-grade students who were enrolled in private schools located within the 50 states and the District of Columbia.
NAEP Technical Documentation 2022 Fourth- and Eighth-Grade Public School National Assessment in Mathematics and Reading
For the mathematics and reading assessments in fourth- and eighth-grade public schools, the national samples were formed by the collective state assessment samples for each jurisdiction, including Bureau of Indian Education (BIE) and Department of Defense Educational Activity (DoDEA) schools. All jurisdictions participated in the mathematics and reading assessments, with the exception of Puerto Rico, where only the operational mathematics assessment was conducted.
NAEP Technical Documentation Sample Design for the 2022 National Long-Term Trend Assessment
Unlike most NAEP assessments, the 2022 long-term trend (LTT) assessments target students based on age rather than grade. The age populations for NAEP 2022 are as follows:
![]() age 9
population: all
students born
in 2012
(i.e., all
students who
were nine
years old
on December
31, 2021);
and
age 9
population: all
students born
in 2012
(i.e., all
students who
were nine
years old
on December
31, 2021);
and
![]() age 13
population: all
students born
in 2009
(i.e., all
students who
were thirteen
years old
on December
31, 2022).
age 13
population: all
students born
in 2009
(i.e., all
students who
were thirteen
years old
on December
31, 2022).
The NAEP
2022 sample
design consisted
of nationally
representative samples
of students
for the
following assessments:
![]() reading at age 9;
reading at age 9;
Selection of Primary Sampling Units
2022 Public School Long-Term Trend Assessment 2022 Private School Long-Term Trend Assessment School and Student Participation Results
![]() mathematics at age 9;
mathematics at age 9;
![]() reading at age 13; and
reading at age 13; and
![]() mathematics at
age 13.
mathematics at
age 13.
This was
accomplished by
designing separate
sample components
for public
and private
schools for
each age.
The selected
samples were
based on
a three-stage
sample design:
![]() selection of primary sampling units (PSUs);
selection of primary sampling units (PSUs);
![]() selection of
schools within
strata; and
selection of
schools within
strata; and
![]() selection of students within schools.
selection of students within schools.
The samples of schools were selected with probability proportional to a measure of size based on the estimated age 9 or age 13 enrollment in the schools. An adjustment was made to the initial measures of size in an attempt to ensure the inclusion of all eligible schools that were part of the 2020 LTT sample for the respective age (9 or 13). The NAEP sampling procedures used an adaptation of the Keyfitz process to compute conditional measures of size that, by design, maximized the overlap of schools selected for both the 2020 and 2022 LTT assessments.
The target population included all nine year old students or thirteen year old students (according to the age definitions above) in public and private schools, including Bureau of Indian Education (BIE) and Department of Defense Education Activity (DoDEA) schools located in the U.S. (but not overseas).
All LTT assessments in 2022 were paper-based assessments (PBA) administered using paper and pencil. The sample design for the long-term trend assessments is described in more detail in subsequent pages.

NAEP Technical Documentation 2022 Private School Long-Term Trend Assessment
The NAEP 2022 sample design yielded nationally representative samples of private school students at ages 9 and 13 for long-term trend (LTT) through a three-stage approach:
![]() selection of
primary sampling
units (PSUs);
selection of
primary sampling
units (PSUs);
![]() selection of schools within strata; and
selection of schools within strata; and
![]() selection of students within schools.
selection of students within schools.
The sample of schools was selected with probability proportional to a measure of size based on the estimated age enrollment in the schools.
The 2022 sampling plan was designed to assess 1,640 students in private schools for LTT at each age. These students were allocated among tests in mathematics and reading. Target sample sizes were adjusted to reflect expected private school and student response and eligibility.
Schools on the sampling frame were explicitly stratified prior to sampling by private school affiliation (Catholic, non-Catholic, and unknown affiliation). Within affiliation type, schools were implicitly stratified by PSU type (certainty/noncertainty). In certainty PSUs, further stratification was by census region, urbanization classification, and estimated age enrollment. In noncertainty PSUs, additional stratification was by PSU stratum, urbanization classification, and estimated age enrollment.
Target Population Sampling Frame Stratification of Schools Sampling of Schools Substitute Schools Ineligible Schools Student Sample Selection
From the stratified frame of private schools, systematic random samples of age-eligible schools were drawn with probability proportional to a
measure of size based on the estimated age enrollment of the school for the relevant age. The measures of size included an adjustment made in an attempt to ensure the inclusion of all eligible schools that were part of the 2020 private school long-term trend sample for ages 9 and 13. The NAEP sampling procedures used an adaptation of
the Keyfitz process to compute conditional measures of size that, by design, maximized the overlap of schools selected for both the 2020 and 2022 long-term trend assessments at each age.
Each selected school in the private school sample provided a list of eligible enrolled students from which a systematic, equal probability sample of students was drawn.
NAEP Technical Documentation Ineligible Private Schools for the 2022 Long- Term Trend Assessment
The Private School Universe Survey (PSS) school file from which most of the sampled schools were drawn corresponds to the 2019–2020 school year, two years prior to the assessment school year. During the intervening period, some of these schools either closed, no longer offered grades for the age group of interest, or were ineligible for other reasons. In such cases, the sampled schools were coded as ineligible.
The table below presents unweighted counts of sampled private schools by eligibility status, including the reason for ineligibility.
Number of sampled public schools, long-term trend assessment, by eligibility status within age: 2022
-
Eligibility Status
Unweighted count of schools
Unweighted percentage
All age 9 sampled public schools
160
100.00
Eligible schools
140
82.93
No age-eligible students
11
6.71
School closed
11
6.71
Not a regular school
4
2.44
Other ineligible school
0
0.00
Duplicate on sampling frame
2
1.22
All age 13 sampled public schools
180
100.00
Eligible schools
140
75.96
No age-eligible students
25
13.66
School closed
8
4.37
NOTE: Total and eligible school counts are rounded to nearest ten. Percentages are based on unrounded counts. Detail may not sum to totals because of rounding.
SOURCE: U.S. Department of Education, Institute of Education Sciences, National Center for Education Statistics, National Assessment of Educational Progress (NAEP), 2022 Long-Term Trend Assessment.
Eligibility Status Unweighted count of schools Unweighted percentage
-
Not a regular school
10
5.46
Other ineligible school
0
0.00
Duplicate on sampling frame
1
0.55
NOTE: Total and eligible school counts are rounded to nearest ten. Percentages are based on unrounded counts. Detail may not sum to totals because of rounding. SOURCE: U.S. Department of Education, Institute of Education Sciences, National Center for Education Statistics, National Assessment of Educational Progress (NAEP), 2022 Long-Term Trend Assessment.
The tables below present unweighted counts of sampled private schools by age, private school type and eligibility status.
Number of sampled private schools, long-term trend assessment, age 9, by private school type and eligibility status: 2022
-
Private school type
Eligibility status
Unweighted count of schools
Unweighted percentage
All Private
Total
160
100.00
Eligible
140
82.93
Ineligible
28
17.08
Catholic
Total
50
100.00
Eligible
40
91.67
Ineligible
4
8.83
Other Private
Total
120
100.00
Eligible
90
79.31
Ineligible
24
20.69
NOTE: Total and eligible school counts are rounded to nearest ten. Percentages are based on unrounded counts. Detail may not sum to total due to rounding.
SOURCE: U.S. Department of Education, Institute of Education Sciences, National Center for Education Statistics, National Assessment of Educational Progress (NAEP), 2022 Long-Term Trend Assessment.
Number of sampled private schools, long-term trend assessment, age 13, by private school type and eligibility status: 2022
-
Private school type
Eligibility status
Unweighted count of schools
Unweighted percentage
All Private
Total
180
100.00
Eligible
140
75.96
Ineligible
44
24.04
Catholic
Total
60
100.00
Eligible
52
67.74
NOTE: Total and eligible school counts are rounded to nearest ten. Percentages are based on unrounded counts. Detail may not sum to total due to rounding.
SOURCE: U.S. Department of Education, Institute of Education Sciences, National Center for Education Statistics, National Assessment of Educational Progress (NAEP), 2022 Long-Term Trend Assessment.
Private school type Eligibility status Unweighted count of schools Unweighted percentage
-
Ineligible
10
32.26
Other Private
Total
120
100.00
Eligible
87
71.90
Ineligible
34
28.10
NOTE: Total and eligible school counts are rounded to nearest ten. Percentages are based on unrounded counts. Detail may not sum to total due to rounding. SOURCE: U.S. Department of Education, Institute of Education Sciences, National Center for Education Statistics, National Assessment of Educational Progress (NAEP), 2022 Long-Term Trend Assessment.
NAEP Technical Documentation Sampling Frame for the 2022 Private School Long-Term Trend Assessment
The primary sampling frame for private schools was developed from the Private School Universe Survey (PSS) corresponding to the 2019– 2020 school year. The PSS file is the Department of Education’s primary database of elementary and secondary private schools in the 50 states and the District of Columbia, and it is based on a survey conducted by the U.S. Census Bureau during the 2019–2020 school year. This sampling frame is referred to as the PSS-based sampling frame.
The PSS-based sampling frame was restricted to schools located in the primary sampling units (PSUs) selected for the NAEP 2022 long-term
Age Distribution Fractions
New-School Sampling Frame
trend (LTT) assessment. In addition, the sampling frame excluded ungraded schools, vocational schools with no enrollment, special-education-only schools, homeschool entities, prison and hospital schools, and juvenile correctional institutions. Vocational schools with no enrollment serve students who split their time between the vocational school and their home school.
The following table presents the number of schools and estimated enrollment for the PSS-based sampling frame by age population. The unweighted estimated enrollment is restricted to the selected PSUs. The weighted estimated enrollment incorporates the PSU weight (inverse of the probability of selecting the PSU) and the estimated age-eligible enrollment, and thus is a national estimate of the number of private school students in the age population. The age-eligible enrollment was estimated using age distribution fractions (see link above right) derived by grade for each age population.
Number of schools and enrollment in private school sampling frame, long-term trend assessment, by age and affiliation: 2022
-
Age
Affiliation
Number of schools
Estimated enrollment (unweighted)
Estimated enrollment (weighted)
Age Affiliation Number of schools Estimated enrollment (unweighted) Estimated enrollment (weighted)
-
9
Total
12,090
212,540
334,060
Catholic
2,788
76,511
118,126
Non-Catholic
7,398
126,509
202,890
Unknown affiliation
1,904
9,520
13,044
13
Total
12,749
213,077
333,894
Catholic
31793
79,894
119,594
Non-Catholic
7,467
123,668
201,261
Unknown affiliation
1,903
9,575
13,039
NOTE: Detail may not sum to totals due to rounding.
SOURCE: U.S. Department of Education, Institute of Education Sciences, National Center for Education Statistics, National Assessment of Educational Progress (NAEP), 2022 Long-Term Trend Assessment.
For quality control purposes, school and student counts from the sampling frame were compared to school and student counts from previous private school frames by grade (for grades 4 and 8). Comparisons were grade-based because most NAEP assessments are grade-based, and grade counts are a reasonable proxy for age counts for comparison purposes. No major discrepancies were found.
A secondary sampling frame was also created for the age 9 sample to account for schools that newly opened or became newly eligible between the 2019–2020 and 2021– 2022 school years. This frame contains brand-new and newly-eligible schools expected to have 9 year olds and is referred to as the new-school sampling frame. Because there are no sources available to identify new schools for non-Catholic private schools, the new school frame for private schools contains only Catholic schools. Like the PSS-based frame, the new-school sampling frame was restricted to schools in the selected PSUs and certain types of schools were excluded from the frame as described above.
NAEP Technical Documentation Age Distribution Fractions for the 2022 Private School Long-Term Trend (LTT) Assessment
Age distribution fractions are estimated proportions of students in each grade that are age-eligible for sampling. The fractions are components in the school measure of size. For ages 9 and 13, a breakout by every year of birth cohort represented in the relevant grades was fully carried out. The age distribution fractions for the 2020 LTT assessments were also used for 2022. The computation of the age distribution fractions for the age 9 and 13 assessments starts with estimates derived from the NAEP 2017 reading and mathematics assessments. For grades 4 and 8, estimates of the percentages of students by year of birth were computed separately for public and private schools by census region.
These estimates were determined by first computing the weighted counts of assessed, absent, and excluded students for the NAEP 2017 reading and mathematics assessments and then aggregating them. The student base weights were used for this purpose. The weighted aggregations are estimates of the total number of students by year of birth for grade 4 in the school year 2016–2017. The tables below present these estimates by region for fourth grade for private schools.
Weighted aggregations and proportions from the grade 4 reading and mathematics assessments, private schools Northeast region, by year of birth: 2017
-
Year of birth
Weighted aggregations
Weighted proportions
Total
59,000
1.00
2003
33
#
2004
33
#
2005
293
#
2006
16,000
0.26
2007
43,000
0.73
2008
335
0.01
2009
100
#
# Rounds to zero.
NOTE: Detail may not sum to totals because of rounding.
SOURCE: U.S. Department of Education, Institute of Education Sciences, National Center for Education Statistics, National Assessment of Educational Progress (NAEP), 2022 Long-Term Trend Assessment.
Weighted aggregations and proportions from the grade 4 reading and mathematics assessments, private schools Midwest region, by year of birth: 2017
-
Year of birth
Weighted aggregations
Weighted proportions
Total
85,000
1.00
2005
785
0.01
2006
37,000
0.43
2007
48,000
0.56
2008
192
#
# Rounds to zero.
NOTE: Detail may not sum to totals because of rounding.
SOURCE: U.S. Department of Education, Institute of Education Sciences, National Center for Education Statistics, National Assessment of Educational Progress (NAEP), 2022 Long-Term Trend Assessment.
Weighted aggregations and proportions from the grade 4 reading and mathematics assessments, private schools South region, by year of birth: 2017
-
Year of birth
Weighted aggregations
Weighted proportions
Total
108,000
1.00
2005
2,000
0.02
2006
42,000
0.39
2007
63,000
0.58
# Rounds to zero.
NOTE: Detail may not sum to totals because of rounding.
SOURCE: U.S. Department of Education, Institute of Education Sciences, National Center for Education Statistics, National Assessment of Educational Progress (NAEP), 2022 Long-Term Trend Assessment.
Year of birth Weighted aggregations Weighted proportions
-
2008
524
#
# Rounds to zero.
NOTE: Detail may not sum to totals because of rounding.
SOURCE: U.S. Department of Education, Institute of Education Sciences, National Center for Education Statistics, National Assessment of Educational Progress (NAEP), 2022 Long-Term Trend Assessment.
Weighted aggregations and proportions from the grade 4 reading and mathematics assessments, private schools West region, by year of birth: 2017
-
Year of birth
Weighted aggregations
Weighted proportions
Total
60,000
1.00
2005
640
0.01
2006
20,000
0.34
2007
39,000
0.65
2008
263
#
# Rounds to zero.
NOTE: Detail may not sum to totals because of rounding.
SOURCE: U.S. Department of Education, Institute of Education Sciences, National Center for Education Statistics, National Assessment of Educational Progress (NAEP), 2022 Long-Term Trend Assessment.
The combined percentages of the reading and mathematics assessments are the best estimates of the percentages of fourth-graders in school year 2016–2017 by year of birth. The objective is to get the percentages of those born in a particular year (e.g., 2007) who are in grades 2, 3, 4, and 5. Since direct estimates are not available, an indirect estimate can be obtained by assuming that the other grades have the identical distribution as fourth grade, but moved back or moved forward by one year. This effectively assumes a stationary distribution of age and grade, which is only a rough approximation of reality, but it suffices to give good measures of size. The derived percentages by age and grade using this stationarity approximation are illustrated for the Northeast region in the table below.
Grade distribution for private schools Northeast region, 2016–2017 school year, assuming stationarity, by year of birth: 2017
-
Year of birth
Second grade
Third grade
Fourth grade
Fifth grade
Sixth grade
Total
1.00
1.00
1.00
1.00
1.00
2003
#
#
#
#
#
2004
#
#
#
#
0.26
2005
#
#
#
0.26
0.73
2006
#
#
0.26
0.73
0.01
2007
#
0.26
0.73
0.01
#
2008
0.26
0.73
0.01
#
#
2009
0.73
0.01
#
#
#
# Rounds to zero.
NOTE: Detail may not sum to totals because of rounding.
SOURCE: U.S. Department of Education, Institute of Education Sciences, National Center for Education Statistics, National Assessment of Educational Progress (NAEP), 2022 Long-Term Trend Assessment.
In distribution, the third-graders are exactly one year younger, the second-graders exactly two years younger, etc. If we read across the grade distribution for those born in 2007, we see that the percentages for second through sixth grades are equal to the percentages for 2005 through 2009 for fourth grade. The same logic was applied to all four tables provided above, yielding estimates of the percentages of nine year olds by grade that were used to compute school measures of size during the sampling of private schools.
Back to Top
A similar logic applied to the age 13 sample. For the age 13 sample, the starting point was the NAEP 2017 grade 8 reading and mathematics assessments. Aggregated estimates were computed in the same way as for the age 9 sample. The four tables below provide these estimates by region for eighth grade for public schools.
Weighted aggregations and proportions from the grade 8 reading and mathematics assessments, private schools Northeast region, by year of birth: 2017
-
Year of birth
Weighted aggregations
Weighted proportions
Total
63,000
1.00
2000
156
#
2001
621
0.01
2002
19,000
0.31
2003
42,000
0.67
2004
675
0.01
# Rounds to zero.
NOTE: Detail may not sum to totals because of rounding.
SOURCE: U.S. Department of Education, Institute of Education Sciences, National Center for Education Statistics, National Assessment of Educational Progress (NAEP), 2022 Long-Term Trend Assessment.
Weighted aggregations and proportions from the grade 8 reading and mathematics assessments, private schools Midwest region, by year of birth: 2017
-
Year of birth
Weighted aggregations
Weighted proportions
Total
78,000
1.00
2001
992
0.01
2002
31,000
0.40
2003
45,000
0.58
2004
173
#
# Rounds to zero.
NOTE: Detail may not sum to totals because of rounding.
SOURCE: U.S. Department of Education, Institute of Education Sciences, National Center for Education Statistics, National Assessment of Educational Progress (NAEP), 2022 Long-Term Trend Assessment.
Weighted aggregations and proportions from the grade 8 reading and mathematics assessments, private schools South region, by year of birth: 2017
-
Year of birth
Weighted aggregations
Weighted proportions
Year of birth Weighted aggregations Weighted proportions
-
Total
111,000
1.00
2000
75
#
2001
2,000
0.02
2002
46,000
0.41
2003
63,000
0.57
2004
418
#
# Rounds to zero.
NOTE: Detail may not sum to totals because of rounding.
SOURCE: U.S. Department of Education, Institute of Education Sciences, National Center for Education Statistics, National Assessment of Educational Progress (NAEP), 2022 Long-Term Trend Assessment.
Weighted aggregations and proportions from the grade 8 reading and mathematics assessments, private schools West region, by year of birth: 2017
-
Year of birth
Weighted aggregations
Weighted proportions
Total
52,000
1.00
2000
29
#
2001
503
0.01
2002
15,000
0.28
2003
37,000
0.70
2004
272
0.01
# Rounds to zero.
NOTE: Detail may not sum to totals because of rounding.
SOURCE: U.S. Department of Education, Institute of Education Sciences, National Center for Education Statistics, National Assessment of Educational Progress (NAEP), 2022 Long-Term Trend Assessment.
NAEP Technical Documentation New-School Sampling Frame for the 2022 Private School Long-Term Trend Assessment
The NAEP 2022 private school frame was constructed using the most current Private School Universe Survey (PSS) file available from NCES. This file contained schools that were in existence during the 2019–2020 school year, (i.e., it was two years out of date). During the subsequent 2-year period, undoubtedly, some schools closed, some changed structure (one school becoming two schools, for example), some newly opened, and still others changed their grade span.
A supplemental sample was selected from a list of Catholic schools that were new or had become newly eligible sometime after the 2019–2020 school year. The goal was to allow every new Catholic school a chance of selection, thereby fully covering the target population of Catholic schools in operation during the 2021–2022 school year. It was infeasible to ask every Catholic diocese in the United States to provide a supplemental school frame, so a two-stage procedure was employed. First, a sample of dioceses was selected. Then the National Catholic Educational Association (NCEA) was sent a list of the schools within their sampled dioceses that had been present on the 2019–2020 PSS file. NCEA was asked to add in any new schools and update grade span for the schools on this list.
The new-school process began with the preparation of a diocese-level frame. The starting point was a file containing every Catholic diocese in the U.S. classified as small, medium, or large based on the number of schools and student enrollment of schools from the PSS private school frame. The new-school process for long-term trend (LTT) piggybacked on the process for the grade-based samples as follows:
A diocese was considered to be small if it contained no more than one school at each of grades 4 and 8. During school recruitment, schools sampled from small dioceses were asked to identify schools within their dioceses that newly offered the targeted grades (grades 2-5 for age 9). From a sampling perspective, each new school was viewed as an "annex" to the sampled school, which meant that it had a well-defined probability of selection equal to that of the sampled school. When a school in a small diocese was sampled from the PSS frame, its associated new school was automatically sampled as well.
Dioceses that were not small were further divided into two strata, one containing large-size dioceses and a second containing medium-size dioceses. These strata were defined by computing the percentage of grade 4 and 8 enrollment represented by each diocese, sorting in descending order, and cumulating the percentages. All dioceses up to
and including the first diocese at or above the 80th cumulative percentage were defined as large dioceses. The remaining dioceses were defined as medium dioceses.
A simplified example is given below. The dioceses are ordered by descending percentage enrollment. The first six become large dioceses and the last six become medium dioceses.
Example showing assignment of Catholic dioceses to the large-size and medium-size diocese strata, 2022
-
Diocese
Percentage enrollment
Cumulative percentage enrollment
Stratum
Diocese 1
20
20
L
Diocese 2
20
40
L
Diocese 3
15
55
L
Diocese 4
10
65
L
Diocese 5
10
75
L
Diocese 6
10
85
L
Diocese 7
5
90
M
Diocese 8
2
92
M
Diocese 9
2
94
M
Diocese 10
2
96
M
Diocese 11
2
98
M
Diocese 12
2
100
M
SOURCE: U.S. Department of Education, Institute of Education Sciences, National Center for Education Statistics, National Assessment of Educational Progress (NAEP), 2022 Long-Term Trend Mathematics and Reading Assessments.
In actuality, there were 77 large and 96 medium dioceses in the sampling frame.
The target sample size was 10 dioceses total across the medium-size and large-size diocese strata: eight from the large-size diocese stratum and two from the medium-size diocese stratum.
In the medium-size diocese stratum, dioceses were selected with equal probability. In the large-size diocese stratum, dioceses were sampled with probability proportional to enrollment. These probabilities were retained and used in later stages of sampling and weighting of new schools.
NCEA was sent a listing of all the schools in the selected dioceses that appeared on the 2019–2020 PSS file and was asked to provide information about the new schools not included in the file and grade span changes of existing schools. These listings were used as sampling frames for selection of new Catholic schools and updates of existing schools, keeping in mind that grades 2-5 were targeted for age 9. In addition, the new-school frames were limited to the geographic areas covered by the sampled LTT primary sampling units (PSUs).
The following table presents the number and percentage of schools and average estimated age enrollment for the age 9 "new-school" frames by census region. For age 9 there were no new schools in the Midwest region.
Number and percentage of schools and mean school size in the private new-school frame, long-term trend assessment for age 9, by census region: 2022
-
Census region
Schools
Percentage
Mean school size
Total
15
100.00
32
Northeast
11
73.33
37
Midwest
0
0.00
0
South
3
20.00
11
West
1
6.67
35
SOURCE: U.S. Department of Education, Institute of Education Sciences, National Center for Education Statistics, National Assessment of Educational Progress (NAEP), 2022 Long-Term Trend Mathematics and Reading Assessments.
For age 13 a private new-school frame was not constructed. Based on the 2022 experience with age 9, where only one of the new schools on the frame was sampled, it was decided not to conduct a private new-school procedure for age 13. Because the age 13 assessment was in a different school year than age 9, conducting the new-school procedure for age 13 would have required that the process described above be carried out anew, one year after the age 9 process was conducted.
NAEP Technical Documentation Sampling of Private Schools for the 2022 Long- Term Trend Assessment
In designing the private school long-term trend samples for each age, six objectives underlie the process of determining the probability of selection for each school and the number of students to be sampled from each selected school:
![]() to meet the overall target student sample size;
to meet the overall target student sample size;
![]() to select
an equal-probability
sample of
students from
each age
population;
to select
an equal-probability
sample of
students from
each age
population;
![]() to limit the number of students selected from any one school;
to limit the number of students selected from any one school;
![]() to ensure
that the
sample within
a school
does not
include a
very high
percentage of
the students
in the
school, unless
all students
are included;
to ensure
that the
sample within
a school
does not
include a
very high
percentage of
the students
in the
school, unless
all students
are included;
![]() to reduce
the sampling
rate of
small schools,
in recognition
of the
greater cost
and burden
per student
of conducting
assessments in
such schools;
and
to reduce
the sampling
rate of
small schools,
in recognition
of the
greater cost
and burden
per student
of conducting
assessments in
such schools;
and
![]() to ensure the inclusion of all eligible schools that were part
of the 2020 private school long-term trend sample for each age,
respectively.
to ensure the inclusion of all eligible schools that were part
of the 2020 private school long-term trend sample for each age,
respectively.
The goal in determining the school's measure of size is to optimize across the second to the fifth objectives in terms of maintaining the precision of estimates and the cost effectiveness of the sample design.
Therefore, to meet the target student sample size objective and achieve a reasonable compromise among the next four objectives, the following algorithm was used to assign a measure of size to each school based on its estimated age enrollment as indicated on the sampling frame.
The measures of size vary by enrollment size. The initial measures of size, \(MOS_{js}\), were set as follows: \begin{equation} MOS_{js} = PSCHWT_{s} \times PSU\_WT_{s} \times \left\{\begin{array}{llll} x_{js}{,} & \text{if } z_{js} < x_{js} \\ y_{j}{,} & \text{if } 19 < x_{js} \leq z_{js}\\ \biggl(\dfrac{y_j}{20}\biggr) \times x_{js}{,} & \text{if } 10 < x_{js} \leq 19 \\ \dfrac{y_j}{2}{,} & \text{if } x_{js} \leq 10 \\ \end{array}\right. \end{equation}
where \(PSCHWT_{s}\) is the Private School Universe Survey area frame weight for school \(s\); \(PSU\_WT_{s}\) is the PSU weight (i.e., the inverse of the PSU probability of selection) for school \(s\); \(x_{js}\) is the estimated age enrollment for school \(s\) for sample age \(j\); \(y_{j}\) is the target within-school student sample size for
sample age \(j\); and \(z_{js}\) is the within-school take-all student cutoff for school \(s\) for sample age \(j\). The target within-school sample size and the within-school take- all cutoff were both 50.
The measures of size for schools in the Honolulu Primary Sampling Unit (PSU) were doubled to increase their chances of selection. Schools in the Honolulu PSU have their measures of size doubled to ensure at least one sampled school from the PSU. The Honolulu PSU is a certainty not due to its size, but because it is unique due to its high population of Asian and Native Hawaiian/Pacific Islander students. The preliminary measures of size \(M_{js}\) for schools in the Honolulu PSU were set as \begin{equation} M_{js} = 2 \times MOS_{js}. \end{equation}
Preliminary measures of size for schools not in the Honolulu PSU were set equal to the initial measures of size.
The preliminary school measure of size is rescaled to create an expected number of hits by applying a multiplicative constant \(b_{j}\), which varies by age \(j\). One can choose a value of \(b_{j}\) such that the expected overall student sample yield matches the desired target specified by the design, where the expected yield is calculated by summing the product of an individual school's probability and its student yield across all schools in the frame. For private schools, this parameter varied by private school affiliation (Catholic, non-Catholic, and unknown affiliation).
The final measure of size, \(E_{js}\), is defined as
\begin{equation} E_{js}=min(b_{j}\times M_{js},u_{j}). \end{equation}
The quantity \(u_{j}\) (the maximum number of hits allowed) in this formula is designed to put an upper bound on the burden for the sampled schools. For private schools, \ (u_{j}\) is 1 because by design a school could not be selected, or hit in the sampling process more than once for a given sample age.
To address the objective in the last bullet above, an adjustment was made to the initial measures of size in an attempt to ensure the inclusion of all eligible schools that were part of the 2020 private school long-term trend sample for each age. The NAEP sampling procedures used an adaptation of the Keyfitz process to compute conditional measures of size that, by design, maximized the overlap of schools selected for both the 2020 and 2022 long-term trend assessments.
Schools were ordered within each sampling stratum using the serpentine sort described under the stratification of private schools. A systematic sample was then drawn using this serpentine-sorted list and the measures of size. The numbers of private schools selected were approximately 160 for age 9 and 180 for age 13.
NAEP Technical Documentation Stratification of Private Schools for the 2022 Long-Term Trend Assessment
For the private school sampling frame file at each age (9 or 13), schools were explicitly stratified by private school affiliation (Catholic, non-Catholic, and unknown affiliation). Private school affiliation was unknown for nonrespondents to the NCES Private School Universe Survey (PSS). Within private school type, separate implicit stratification schemes were used to sort schools in certainty primary sampling units (PSUs) and noncertainty PSUs. In all cases, the implicit stratification was achieved via a "serpentine sort".
Within each
certainty PSU,
the schools
were hierarchically
sorted by
![]() census region;
census region;
![]() urbanization
classification (four
categories based
on urban-centric
locale); and
urbanization
classification (four
categories based
on urban-centric
locale); and
![]() estimated age-specific enrollment.
estimated age-specific enrollment.
Schools in
noncertainty PSUs
were hierarchically
sorted by
![]() PSU stratum;
PSU stratum;
![]() urbanization
classification (four
categories based
on urban-centric
locale); and
urbanization
classification (four
categories based
on urban-centric
locale); and
![]() estimated age-specific enrollment.
estimated age-specific enrollment.
NAEP Technical Documentation Student Sample Selection for the 2022 Private School Long-Term Trend Assessment
Students in private schools were selected in the same way as students in the public schools, except that there was no oversampling of Black, Hispanic, and American Indian/Alaska Native students.
About 37 percent of the participating private schools submitted student lists through E-filing, and the remaining 63 percent submitted paper lists.
NAEP Technical Documentation Substitute Private Schools for the 2022 Long- Term Trend Assessment
Substitutes were preselected for the private school samples by sorting the school frame file for each of ages 9 and 13 according to the actual order used in the sampling process (the implicit stratification). For operational reasons, the original selection order was embedded within the sampled primary sampling unit (PSU) and state. Each sampled school with known affiliation had each of its nearest neighbors within the same sampling stratum on the school frame file identified as a potential substitute. Sampled schools with unknown affiliation were not assigned substitutes. Since age-specific enrollment was used as the last sort ordering variable, the nearest neighbors had age-specific enrollment values very close to that of the sampled school. This was done to facilitate the selection of about the same number of students within the substitute as would have been selected from the original sampled school.
Schools were disqualified as potential substitutes if they were already selected in any of the original private school samples, assigned as a substitute for another private school (earlier in the sort ordering), or were not the same affiliation as the originally sampled school.
If both nearest neighbors were still eligible to be substitutes, the one with a closer age-specific enrollment was chosen. If both nearest neighbors were equally distant from the sampled school in their age-specific enrollment (an uncommon occurrence), one of the two was randomly selected.
Of the approximately 160 originally sampled private schools for age 9, about 80 schools had a substitute activated because the original eligible school did not participate, and a handful of those activated substitutes participated. For age 13, of the approximately 180 originally sampled private schools, about 80 also had a substitute activated because the original eligible school did not participate. Similar to age 9, only a handful of activated substitutes for age 13 participated.
NAEP Technical Documentation Target Population of the 2022 Private School Long-Term Trend Assessment
The target populations for the 2022 long-term trend private school assessments included all students who were age 9 (i.e., born in 2012) or age 13 (born in 2009) in private schools in the 50 states and the District of Columbia.
NAEP Technical Documentation 2022 Public School Long-Term Trend Assessment
The NAEP 2022 sample design yielded nationally representative samples of public school students at ages 9 and 13 for long-term trend (LTT) through a three-stage approach:
![]() selection of
primary sampling
units (PSUs);
selection of
primary sampling
units (PSUs);
![]() selection of schools within strata; and
selection of schools within strata; and
![]() selection of students within schools.
selection of students within schools.
The sample of schools was selected with probability proportional to a measure of size based on the estimated age enrollment in the schools.
The 2022 sampling plan was designed to assess 14,760 students at each age in public schools for LTT. These students were allocated among tests in mathematics and reading. Target sample sizes were adjusted to reflect expected public school and student response and eligibility.
Schools on the sampling frame were explicitly stratified prior to sampling by PSU type (certainty/noncertainty). Within certainty PSUs, schools were implicitly stratified by census region, American Indian/Alaska Native (AI/AN) stratum, urbanization classification, race/ethnicity
Target Population Sampling Frame Stratification of Schools Sampling of Schools Substitute Schools Ineligible Schools Student Sample Selection
stratum, and race/ethnicity percentage. Within noncertainty PSUs, schools were implicitly stratified by PSU stratum, AI/AN stratum, urbanization classification, and race/ethnicity percentage. Note that the use of the AI/AN stratum as an implicit stratification variable helped ensure that a reasonable number of schools with sufficient numbers of AI/AN students in them were selected.
From the stratified frame of public schools, systematic random samples of age-eligible schools were drawn with probability proportional to a measure of size based on the estimated age enrollment of the school for the relevant age. The measures of size included an adjustment made in an attempt to ensure the inclusion of all eligible schools that were part of the 2020 public school long-term trend sample for ages 9 and 13. The NAEP sampling procedures used an adaptation of the Keyfitz process to compute conditional measures of size that, by design, maximized the overlap of schools selected for both the 2020 and 2022 long-term trend assessments at each age.
Additionally, AI/AN, Black, and Hispanic students were oversampled at moderate rates as follows. First, schools in a high AI/AN stratum (i.e., schools with at least five percent AI/AN students and at least five AI/AN students at the sample age) were sampled at four times the rate (by quadrupling their measure of size) as schools not in a high AI/AN stratum to implement oversampling of AI/AN students. Second, schools not in a high AI/AN stratum but in a high Black/Hispanic stratum (i.e., schools that were not oversampled for AI/AN students and with at least 15 percent Black/Hispanic students and at least 10 Black/Hispanic students at the sample age) were sampled at twice the rate (by doubling their measure of size) as schools not in a high Black/Hispanic stratum to implement oversampling of Black and Hispanic students. This approach is effective in increasing the sample sizes of AI/AN, Black, and Hispanic students without inducing undesirably large design effects on the sample, either overall or for particular subgroups.
Finally, schools in the Honolulu PSU were oversampled at twice the rate (by doubling their measure of size) as schools not in the Honolulu PSU. This was done to ensure at least one school was sampled from this PSU. At least one school was sampled because the total measure of size for all schools in Honolulu exceeded the sampling interval. The PSU was selected with certainty not due to its size, but because it is unique due to its high population of Asian and Native Hawaiian/Pacific Islander students.
Each selected school in the public school sample provided a list of age-eligible enrolled students from which a systematic sample of students was drawn. Within each school, students of the same race/ethnicity were selected with equal probability.
NAEP Technical Documentation Ineligible Public Schools for the 2022 Long-Term Trend Assessment
The Common Core of Data (CCD) public school file from which most of the sampled schools were drawn corresponds to the 2019–2020 school year for age 9 and 2020–2021 for age 13, one and two years prior to the assessment school year. During the intervening period, some of these schools either closed, no longer offered the grades corresponding to the sample age of interest, or became ineligible for other reasons. In such cases, the sampled schools were considered to be ineligible.
The table below presents unweighted counts of sampled public schools by eligibility status, including the reason for ineligibility.
Number of sampled public schools, long-term trend assessment, by eligibility status within age: 2022
-
Eligibility Status
Unweighted count of schools
Unweighted percentage
All age 9 sampled public schools
410
100.00
Eligible schools
400
96.62
No age-eligible students
7
1.69
School closed
5
1.21
Not a regular school
2
0.48
Other ineligible school
0
0.00
Duplicate on sampling frame
0
0.00
All age 13 sampled public schools
500
100.00
Eligible schools
460
92.00
No age-eligible students
26
5.20
School closed
6
1.20
Not a regular school
9
1.80
Other ineligible school
1
0.20
Duplicate on sampling frame
0
0.00
NOTE: Total and eligible school counts are rounded to nearest ten. Percentages are based on unrounded counts. Detail may not sum to totals because of rounding.
SOURCE: U.S. Department of Education, Institute of Education Sciences, National Center for Education Statistics, National Assessment of Educational Progress (NAEP), 2022 Long-Term Trend Assessment.
NAEP Technical Documentation Sampling Frame for the 2022 Public School Long- Term Trend Assessment
Drawing the school samples for the 2022 assessment required a comprehensive list of public schools in each jurisdiction containing information for stratification purposes. As in previous NAEP assessments, the Common Core of Data (CCD) file developed by NCES was used to construct the sampling frame. The CCD file corresponding to the 2019–2020 school year provided the frame for all regular public (as classified by the CCD), state-operated public (as classified by the CCD), Bureau of Indian Education (BIE), and Department of Defense Education Activity (DoDEA) schools serving age 9 in the 50 states and the District of Columbia. The school frame for age 13 was based on the CCD file corresponding to the 2020–2021 school year.
The respective sampling frames were restricted to schools located in the primary sampling units (PSUs) selected for the NAEP 2022 long-term
Age Distribution Fractions
New-School Sampling Frame
trend (LTT) assessment. In addition, the sampling frames excluded ungraded schools, vocational schools with no enrollment, special-education-only schools, homeschool entities, prison or hospital schools, and juvenile correctional institutions. Vocational schools with no enrollment serve students who split their time between the vocational school and their home school.
The public school frame for the LTT assessment for age 9 contained approximately 29,000 schools. The estimated age 9 enrollment (unweighted) for these schools was 2.17 million and the estimated age 9 enrollment (weighted) was 3.71 million. The unweighted estimated enrollments are restricted to the selected PSUs for LTT. The weighted estimated enrollments incorporate the PSU weight (inverse of the probability of selecting the PSU), and thus are national estimates of the number of public school students for the age 9 population. The age-eligible enrollment was estimated using age distribution fractions (see link above right) derived by grade for the age 9 population. The school frame for age 13 contained approximately 25,000 schools. The unweighted estimated age 13 enrollment was 2.20 million, and the weighted estimated age 13 enrollment was
3.77 million.
For quality control purposes, school and student counts from the sampling frame were compared to school and student counts from previous public school frames by
grade (grade 4 for age 9 and grade 8 for age 13). Comparisons were grade-based because most NAEP assessments are grade-based, and grade counts are a reasonable proxy for age counts for comparison purposes. No major discrepancies were found.
A secondary sampling frame was also created for each age to account for schools that newly opened or became newly eligible between the 2019–2020 school year and the school year at the time of assessment (2021–2022 for age 9 and 2022–2023 for age 13). This frame contains brand-new and newly-eligible schools expected to have 9 (or 13) year olds, and is referred to as the new-school sampling frame. Like the CCD-based frame, the new-school sampling frame is restricted to schools in the selected PSUs and certain types of schools were excluded from the frame as described above.
NAEP Technical Documentation Age Distribution Fractions for the 2022 Public School Long-Term Trend (LTT) Assessment
Age distribution fractions are estimated proportions of students in each grade that are age-eligible for sampling. The fractions are components in the school measure of size. For ages 9 and 13 a breakout by every year of birth cohort represented in the relevant grades was fully carried out. The age distribution fractions for the 2020 LTT assessments were also used for 2022. The computation of the age distribution fractions for the age 9 and 13 assessments starts with estimates derived from the NAEP 2017 reading and mathematics assessments. For grades 4 and 8, estimates of the percentages of students by year of birth were computed separately for public and private schools by census region.
These estimates were determined by first computing the weighted counts of assessed, absent, and excluded students for the NAEP 2017 reading and mathematics assessments and then aggregating them. The student base weights were used for this purpose. The weighted aggregations are estimates of the total number of students by year of birth for grade 4 or 8 in the school year 2016–2017. The tables below present these estimates by region for fourth grade for public schools.
Weighted aggregations and proportions from the grade 4 reading and mathematics assessments, public schools Northeast region, by year of birth: 2017
-
Year of birth
Weighted aggregations
Weighted proportions
Total
578,000
1.00
2003
21
#
2004
160
#
2005
6,000
0.01
2006
161,000
0.28
2007
409,000
0.71
2008
877
#
2009
25
#
# Rounds to zero.
NOTE: Detail may not sum to totals because of rounding.
SOURCE: U.S. Department of Education, Institute of Education Sciences, National Center for Education Statistics, National Assessment of Educational Progress (NAEP), 2022 Long-Term Trend Assessment.
Weighted aggregations and proportions from the grade 4 reading and mathematics assessments, public schools Midwest region, by year of birth: 2017
-
Year of birth
Weighted aggregations
Weighted proportions
Total
765,000
1.00
2003
16
#
# Rounds to zero.
NOTE: Detail may not sum to totals because of rounding.
SOURCE: U.S. Department of Education, Institute of Education Sciences, National Center for Education Statistics, National Assessment of Educational Progress (NAEP), 2022 Long-Term Trend Assessment.
-
2004
319
#
2005
11,000
0.01
2006
304,000
0.40
2007
448,000
0.59
2008
832
#
2009
55
#
# Rounds to zero.
NOTE: Detail may not sum to totals because of rounding.
SOURCE: U.S. Department of Education, Institute of Education Sciences, National Center for Education Statistics, National Assessment of Educational Progress (NAEP), 2022 Long-Term Trend Assessment.
Weighted aggregations and proportions from the grade 4 reading and mathematics assessments, public schools South region, by year of birth: 2017
-
Year of birth
Weighted aggregations
Weighted proportions
Total
1,506,000
1.00
2003
32
#
2004
2,000
#
2005
47,000
0.03
2006
603,000
0.40
2007
853,000
0.57
2008
2,000
#
2009
8
#
# Rounds to zero.
NOTE: Detail may not sum to totals because of rounding.
SOURCE: U.S. Department of Education, Institute of Education Sciences, National Center for Education Statistics, National Assessment of Educational Progress (NAEP), 2022 Long-Term Trend Assessment.
Weighted aggregations and proportions from the grade 4 reading and mathematics assessments, public schools West region, by year of birth: 2017
-
Year of birth
Weighted aggregations
Weighted proportions
Total
896,000
1.00
2003
1
#
2004
123
#
2005
5,000
0.01
2006
250,000
0.28
# Rounds to zero.
NOTE: Detail may not sum to totals because of rounding.
SOURCE: U.S. Department of Education, Institute of Education Sciences, National Center for Education Statistics, National Assessment of Educational Progress (NAEP), 2022 Long-Term Trend Assessment.
-
2007
639,000
0.71
2008
1,000
#
2009
14
#
# Rounds to zero.
NOTE: Detail may not sum to totals because of rounding.
SOURCE: U.S. Department of Education, Institute of Education Sciences, National Center for Education Statistics, National Assessment of Educational Progress (NAEP), 2022 Long-Term Trend Assessment.
The combined percentages of the reading and mathematics assessments are the best estimates of the percentages of fourth-graders in school year 2016–2017 by year of birth. The objective is to get the percentages of those born in a particular year (e.g., 2007) who are in grades 2, 3, 4, and 5. Since direct estimates are not available, an indirect estimate can be obtained by assuming that the other grades have the identical distribution as fourth grade, but moved back or moved forward by one year. This effectively assumes a stationary distribution of age and grade, which is only a rough approximation of reality, but it suffices to give good measures of size. The derived percentages by age and grade using this stationarity approximation are illustrated for the Northeast region in the table below.
Grade distribution for public schools Northeast region, 2016–2017 school year, assuming stationarity, by year of birth: 2017
-
Year of birth
Second grade
Third grade
Fourth grade
Fifth grade
Sixth grade
Total
1.00
1.00
1.00
1.00
1.00
2003
#
#
#
#
0.01
2004
#
#
#
0.01
0.28
2005
#
#
0.01
0.28
0.71
2006
#
0.01
0.28
0.71
#
2007
0.01
0.28
0.71
#
#
2008
0.28
0.71
#
#
#
2009
0.71
#
#
#
#
# Rounds to zero.
NOTE: Detail may not sum to totals because of rounding.
SOURCE: U.S. Department of Education, Institute of Education Sciences, National Center for Education Statistics, National Assessment of Educational Progress (NAEP), 2022 Long-Term Trend Assessment.
In distribution, the third-graders are exactly one year younger, the second-graders exactly two years younger, etc. If we read across the grade distribution for those born in 2007, we see that the percentages for second through sixth grades are equal to the percentages for 2005 through 2009 for fourth grade. The same logic was applied to all four tables provided above, yielding estimates of the percentages of nine year olds by grade that were used to compute school measures of size during the sampling of public schools.
Back to Top
A similar logic applied to the age 13 sample. For the age 13 sample, the starting point was the NAEP 2017 grade 8 reading and mathematics assessments. Aggregated estimates were computed in the same way as for the age 9 sample. The four tables below provide these estimates by region for eighth grade for public schools.
Weighted aggregations and proportions from the grade 8 reading and mathematics assessments, public schools Northeast region, by year of birth: 2017
-
Year of birth
Weighted aggregations
Weighted proportions
Total
569,000
1.00
1999
35
#
2000
737
#
2001
11,000
0.02
2002
165,000
0.29
2003
391,000
0.69
2004
2,000
#
2005
73
#
# Rounds to zero.
NOTE: Detail may not sum to totals because of rounding.
SOURCE: U.S. Department of Education, Institute of Education Sciences, National Center for Education Statistics, National Assessment of Educational Progress (NAEP), 2020 Long-Term Trend Assessment.
Weighted aggregations and proportions from the grade 8 reading and mathematics assessments, public schools Midwest region, by year of birth: 2017
-
Year of birth
Weighted aggregations
Weighted proportions
Total
753,000
1.00
1999
223
#
2000
410
#
2001
14,000
0.02
2002
305,000
0.40
2003
433,000
0.57
2004
1,000
#
2005
43
#
# Rounds to zero.
NOTE: Detail may not sum to totals because of rounding.
SOURCE: U.S. Department of Education, Institute of Education Sciences, National Center for Education Statistics, National Assessment of Educational Progress (NAEP), 2020 Long-Term Trend Assessment.
Weighted aggregations and proportions from the grade 8 reading and mathematics assessments, public schools South region, by year of birth: 2017
-
Year of birth
Weighted aggregations
Weighted proportions
Total
1,384,000
1.00
# Rounds to zero.
NOTE: Detail may not sum to totals because of rounding.
SOURCE: U.S. Department of Education, Institute of Education Sciences, National Center for Education Statistics, National Assessment of Educational Progress (NAEP), 2020 Long-Term Trend Assessment.
Year of birth Weighted aggregations Weighted proportions
-
1999
125
#
2000
3,000
#
2001
59,000
0.04
2002
553,000
0.40
2003
766,000
0.55
2004
3,000
#
2005
108
#
2006
1
#
# Rounds to zero.
NOTE: Detail may not sum to totals because of rounding.
SOURCE: U.S. Department of Education, Institute of Education Sciences, National Center for Education Statistics, National Assessment of Educational Progress (NAEP), 2020 Long-Term Trend Assessment.
Weighted aggregations and proportions from the grade 8 reading and mathematics assessments, public schools West region, by year of birth: 2017
-
Year of birth
Weighted aggregations
Weighted proportions
Total
869,000
1.00
1999
6
#
2000
103
#
2001
8,000
0.01
2002
247,000
0.28
2003
612,000
0.70
2004
2,000
#
2005
45
#
# Rounds to zero.
NOTE: Detail may not sum to totals because of rounding.
SOURCE: U.S. Department of Education, Institute of Education Sciences, National Center for Education Statistics, National Assessment of Educational Progress (NAEP), 2020 Long-Term Trend Assessment.
Back to Top
NAEP Technical Documentation New-School Sampling Frame for the 2022 Public School Long-Term Trend Assessment
The primary sampling frames for the 2022 public school samples for the long-term trend (LTT) assessments in mathematics and reading were constructed using the most current Common Core of Data (CCD) files available from NCES. For age 9, this file contained schools that were in existence during the 2019–2020 school year (i.e., it was two years out of date). Similarly, for age 13, this file contained schools that were in existence during the 2020–2021 school year (also about two years out of date, given the fall 2022 assessment date for age 13). During the subsequent 2-year periods, undoubtedly some schools closed, some changed structure (one school becoming two schools, for example), some newly opened, and still others changed their grade span.
A supplemental sample was selected from a list of schools that were new or had become newly eligible sometime after the school year represented by the CCD (2019–2020 for age 9, and 2020–2021 for age 13). The goal was to allow every new school a chance of selection, thereby fully covering the target population of schools in operation during the school year at the time of assessment (2021–2022 for age 9, and 2022–2023 for age 13). It was infeasible to ask every school district in the United States to provide a supplemental school frame, so a two-stage procedure was employed. First, a sample of school districts was selected within each state. Then each State or Trial Urban District Assessment (TUDA) Coordinator was sent a list of the schools within their sampled districts that had been present on the 2019–2020 CCD file. The Coordinators were asked to add in any new schools and identify any schools on this list that had become newly eligible.
The new-school process began with the preparation of a district-level frame. The starting point was a file containing every public school district in the United States. The new- school process for LTT ages 9 and 13 piggybacked on the process for the grade-based samples as follows:
Specific districts
were designated
as in
sample with
certainty.
They included
the following
districts:
![]() districts in jurisdictions where all schools were selected for
sample;
districts in jurisdictions where all schools were selected for
sample;
![]() state-operated districts;
state-operated districts;
![]() districts in states with fewer than 10 districts;
districts in states with fewer than 10 districts;
![]() charter-only districts
(that is,
districts containing
no schools
other than
charter schools);
and
charter-only districts
(that is,
districts containing
no schools
other than
charter schools);
and
![]() TUDA districts.
TUDA districts.
Then noncertainty districts were classified as small, medium, or large based on the number of schools and student enrollment of schools from the CCD-based public school frame.
A district was considered to be small if it contained no more than one school at each of grades 4 and 8. During school recruitment, the Coordinators were asked to identify schools within their small districts that newly offered the targeted grades (grades 2-5 for age 9, and grades 6-9 for age 13). From a sampling perspective, each new school was viewed as an “annex” to the sampled school, which meant that it had a well-defined probability of selection equal to that of the sampled school. When a school in a small district was sampled from the CCD-based frame, its associated new school was automatically sampled as well.
Within each jurisdiction, districts that were neither certainty selections nor small were divided into two strata, one containing large-size districts and a second containing medium-size districts. These strata were defined by computing the percentage of jurisdiction enrollment represented by each district, sorting in descending order, and cumulating the percentages. All districts up to and including the first district at or above the 80th cumulative percentage were defined as large districts. The remaining districts were defined as medium districts.
A simplified example is given below. The state's districts are ordered by descending percentage enrollment. The first six become large districts and the last six become medium districts.
Large-size and medium-size district strata example, by enrollment, stratum, and district, 2022
-
District
Percentage enrollment
Cumulative percentage enrollment
Stratum
1
20
20
L
2
20
40
L
3
15
55
L
4
10
65
L
5
10
75
L
6
10
85
L
7
5
90
M
8
2
92
M
9
2
94
M
10
2
96
M
11
2
98
M
12
2
100
M
SOURCE: U.S. Department of Education, Institute of Education Sciences, National Center for Education Statistics, National Assessment of Educational Progress (NAEP), 2022 Long-Term Trend Mathematics and Reading Assessments.
The target sample size for each jurisdiction was 10 districts total across the medium-size and large-size district strata. Where possible, eight districts were selected from the large-size district stratum and two districts from the medium-size district stratum. However, in the example above, since there are only six large districts, all of the districts in the large district stratum and four districts from the medium district stratum would have been selected for the new-school inquiry.
If sampling was needed in the medium-size district stratum, districts in this stratum were selected with equal probability. If sampling was needed in the large-size district stratum, the districts in this stratum were sampled with probability proportional to enrollment. These probabilities were retained and used in later stages of sampling and weighting of new schools.
The selected districts in each jurisdiction were then sent a listing of all their schools that appeared on the 2019–2020 CCD file and were asked to provide information about the new schools not included in the file and grade span changes of existing schools. These listings provided by the selected districts were used as sampling frames for selection of new public schools and updates of existing schools. This process was conducted through the NAEP State or TUDA Coordinator in each jurisdiction. The Coordinators were sent the information for all sampled districts in their respective jurisdictions and were responsible for returning the completed updates. Any new schools reported by the states with one or more of the grades 2-5 were eligible for the age 9 assessments. Any new schools reported by the states with one or more of the grades 6-9 were eligible for the age 13 assessments, provided another condition was met. That condition was that the new school was not already on the CCD file used to construct the age 13 school frame. Since that CCD file was one year newer than the one used for all the other NAEP 2022 samples, this condition was necessary. In addition, the LTT new-school frames were limited to the geographic areas covered by the sampled LTT primary sampling units (PSUs).
The following tables present the number and percentage of schools and average estimated age enrollment for the LTT new-school frames by census region for each age.
Number and percentage of schools and mean school size in the public new-school frame, long-term trend assessment for age 9, by census region: 2022
-
Census region
Schools
Percentage
Mean school size
Census region Schools Percentage Mean school size
-
Total
183
100.00
42
Northeast
22
12.02
10
Midwest
37
20.22
20
South
92
50.27
45
West
32
17.49
51
NOTE: Detail may not sum to totals because of rounding.
SOURCE: U.S Department of Education, Institute of Education Sciences, National Center for Education Statistics, National Assessment of Educational Progress (NAEP), 2022 Long-Term Trend Mathematics and Reading Assessments.
Number and percentage of schools and mean school size in the public new-school frame, long-term trend assessment for age 13, by census region: 2022
-
Census region
Schools
Percentage
Mean school size
Total
266
100.00
20
Northeast
42
15.79
12
Midwest
64
24.06
10
South
97
36.47
24
West
63
23.68
27
NOTE: Detail may not sum to totals because of rounding.
SOURCE: U.S Department of Education, Institute of Education Sciences, National Center for Education Statistics, National Assessment of Educational Progress (NAEP), 2022 Long-Term Trend Mathematics and Reading Assessments.
NAEP Technical Documentation Sampling of Public Schools for the 2022 Long- Term Trend Assessment
In designing the public school long-term trend sample for each age, seven objectives underlie the process of determining the probability of selection for each school and the number of students to be sampled from each selected school:
![]() to meet the overall target student sample size;
to meet the overall target student sample size;
![]() to select
an equal-probability
sample of
students from
the age
population;
to select
an equal-probability
sample of
students from
the age
population;
![]() to limit the number of students selected from any one school;
to limit the number of students selected from any one school;
![]() to ensure
that the
sample within
a school
does not
include a
very high
percentage of
the students
in the
school, unless
all students
are included;
to ensure
that the
sample within
a school
does not
include a
very high
percentage of
the students
in the
school, unless
all students
are included;
![]() to reduce
the sampling
rate of
small schools,
in recognition
of the
greater cost
and burden
per student
of conducting
assessments in
such schools;
to reduce
the sampling
rate of
small schools,
in recognition
of the
greater cost
and burden
per student
of conducting
assessments in
such schools;
![]() to increase the number of
American Indian/Alaska Native (AI/AN), Black, and Hispanic
students in the sample; and
to increase the number of
American Indian/Alaska Native (AI/AN), Black, and Hispanic
students in the sample; and
![]() to ensure
the inclusion
of all
eligible schools
that were
part of
the 2020
public school
long-term trend
sample for
each age,
respectively.
to ensure
the inclusion
of all
eligible schools
that were
part of
the 2020
public school
long-term trend
sample for
each age,
respectively.
The goal in determining the school's measure of size is to optimize across the second to the fifth objectives in terms of maintaining the precision of estimates and the cost effectiveness of the sample design.
Therefore, to meet the target student sample size objective and achieve a reasonable compromise among the next four objectives, the following algorithm was used to assign a measure of size to each school based on its estimated age enrollment as indicated on the sampling frame.
The measures of size vary by enrollment size. The initial measures of size, \(MOS_{js}\), were set as follows: \begin{equation} MOS_{js} = PSU\_WT_{s} \times \left\
{\begin{array}{llll} x_{js}{,} & \text{if } z_{js} < x_{js} \\ y_{j}{,} & \text{if } 19 < x_{js} \leq z_{js}\\ \biggl(\dfrac{y_j}{20}\biggr) \times x_{js}{,} & \text{if } 10 < x_{js} \leq 19 \\ \dfrac{y_j}{2}{,} & \text{if } x_{js} \leq 10 \\ \end{array}\right. \end{equation}
where \(PSU\_WT_{s}\) is the PSU weight (i.e., the inverse of the PSU probability of selection) for school \(s\); \(x_{js}\) is the estimated age enrollment for school \(s\) for sample age \(j\); \(y_{j}\) is the target within-school student sample size for sample age \(j\); and \(z_{js}\) is the within-school take-all student cutoff for school \(s\) for sample age \(j\). The target within-school sample size and the within-school take-all cutoff were both 50.
To increase the number of AI/AN students in the sample, the measures of size for schools with relatively high proportions of AI/AN students (5 percent or more and with at least 5 AI/AN students) were quadrupled. The preliminary measures of size \(M_{js}\) for these schools were set as \begin{equation} M_{js} = 4 \times MOS_{js}.
\end{equation}
Likewise, to increase the number of Black and Hispanic students in the sample, the measures of size for schools with relatively high proportions of Black/Hispanic students (15 percent or more and with at least 10 Black/Hispanic students) were doubled if they had not already been quadrupled due to AI/AN enrollment. The preliminary measures of size
\(M_{js}\) for these schools were set as \begin{equation} M_{js} = 2 \times MOS_{js}. \end{equation}This approach is effective in increasing the sample sizes of AI/AN, Black, and Hispanic students without inducing undesirably large design effects on the sample, either overall, or for particular subgroups.
The measures of size for schools in the Honolulu primary sampling unit (PSU) were doubled to increase their chances of selection. Schools in the Honolulu PSU have their measures of size doubled to ensure at least one sampled school from the PSU. The Honolulu PSU is a certainty not due to its size, but because it is unique due to its high population of Asian and Native Hawaiian/Pacific Islander students. The preliminary measures of size \(M_{js}\) for schools in the Honolulu PSU were set as \begin{equation} M_{js} = 2 \times MOS_{js}. \end{equation}
Preliminary measures of size were set equal to the initial measures of size for schools whose measures of size were not doubled or quadrupled.
The preliminary school measure of size is rescaled to create an expected number of hits by applying a multiplicative constant \(b_{j}\), which varies by age \(j\). One can choose a value of \(b_{j}\) such that the expected overall student sample yield matches the desired target specified by the design, where the expected yield is calculated by summing the product of an individual school's probability and its student yield across all schools in the frame.
The final measure of size, \(E_{js}\), is defined as
\begin{equation} E_{js}=min(b_{j}\times M_{js},u_{j}). \end{equation}
The quantity \(u_{j}\) (the maximum number of hits allowed) in this formula is designed to put an upper bound on the burden for the sampled schools. For public schools, \ (u_{j}\) is 1 because by design a school could not be selected, or hit in the sampling process more than once for the given sample age.
In addition, new and newly-eligible schools were sampled from the new school frame. The final measure of size for these schools, \(E_{js}\) is defined as
\begin{equation} E_{js}=min(b_{j}\times M_{js} \times \pi_{djs}^{-1},u_{j}). \end{equation}
The variable \(\pi_{djs}\) is the probability of selection of the district \(d\) into the new-school district sample.
To address the objective in the last bullet above, an adjustment was made to the initial measures of size in an attempt to ensure the inclusion of all eligible schools that were part of the 2020 public school long-term trend sample for each age. The NAEP sampling procedures used an adaptation of the Keyfitz process to compute conditional measures of size that, by design, maximized the overlap of schools selected for both the 2020 and 2022 long-term trend assessments.
Schools were ordered within each jurisdiction using the serpentine sort described under the stratification of public schools. A systematic sample was then drawn using this serpentine-sorted list and the measures of size. The numbers of public schools selected were approximately 410 for age 9 and 480 for age 13.
NAEP Technical Documentation Stratification of Public Schools for the 2022 Long- Term Trend Assessment
For the public school sampling frame file for each of the ages 9 and 13, separate implicit stratification schemes were used to sort schools in certainty primary sampling units (PSUs) and noncertainty PSUs. The implicit stratification was achieved via a "serpentine sort."
For certainty
PSUs, the
schools were
hierarchically sorted
by
![]() census region;
census region;
![]() American Indian/Alaska
Native (AI/AN)
stratum (two
categories based
on percentage
of AI/AN
students);
American Indian/Alaska
Native (AI/AN)
stratum (two
categories based
on percentage
of AI/AN
students);
![]() urbanization classification (four categories based on
urban-centric locale);
urbanization classification (four categories based on
urban-centric locale);
![]() race/ethnicity stratum;
and
race/ethnicity stratum;
and
![]() race/ethnicity percentage.
race/ethnicity percentage.
The two categories within the AI/AN stratum were defined as follows. High AI/AN schools were schools with at least five percent AI/AN students and at least five AI/AN students in the sample age. Low AI/AN schools were those not designated as high AI/AN.
For schools in the high AI/AN stratum, if there were fewer than six expected sampled schools for a particular urbanization classification cell (nested within the AI/AN stratum and census region), the cell was collapsed with a neighboring urbanization classification cell. No race/ethnicity strata were generated. The final sort variable was total percentage of AI/AN students. Note the lower limit of six was chosen to facilitate the construction of nonresponse adjustment classes with sufficient numbers of schools and students in them.
For schools in the low AI/AN stratum, if there were fewer than six expected sampled schools for a particular urbanization classification cell (nested within the AI/AN stratum and census region), the cell was collapsed with a neighboring urbanization classification cell. If the expected sampled schools exceeded 12, then the race/ethnicity strata were defined based on the total percentage of Black, Hispanic, and AI/AN students. The strata were defined so that there were at least six expected sampled schools for each race/ethnicity stratum. Within each race/ethnicity stratum, the final sort variable was total percentage of Black, Hispanic, and AI/AN students. If the urbanization classification stratum had an expected sample size less than 12, no race/ethnicity strata were generated, and the final sort variable was total percentage of Black, Hispanic, and AI/AN students.
Schools in noncertainty PSUs were hierarchically sorted by
![]() PSU stratum;
PSU stratum;
![]() AI/AN stratum (two categories based on percentage of
AI/AN students);
AI/AN stratum (two categories based on percentage of
AI/AN students);
![]() urbanization
classification (four
categories based
on urban-centric
locale); and
urbanization
classification (four
categories based
on urban-centric
locale); and
![]() race/ethnicity percentage.
race/ethnicity percentage.
The collapsing of cells within the noncertainty PSUs was implemented in a fashion similar to that described for certainty PSUs.
For schools in the high AI/AN stratum, the final sort variable was total percentage of AI/AN students. For schools in the low AI/AN stratum, the final sort variable was total percentage of Black, Hispanic, and AI/AN students.
NAEP Technical Documentation Student Sample Selection for the 2022 Public School Long-Term Trend Assessment
The sampling of students for the public school assessments involved two steps: (1) sampling of students of the targeted age (9 or 13) from each sampled school, and (2) assignment of assessment subject (mathematics or reading) to the sampled students.
Sampling Students within Sampled Schools
All age-eligible students in the school were sampled if the school had 50 or fewer students of that age. Otherwise, a sample of 50 students was selected without replacement.
To increase the numbers of Black, Hispanic, and American Indian/Alaska Native (AI/AN) students in the assessment, students who were Black, Hispanic, or AI/AN were oversampled in some public schools. In particular, up to 5 extra Black, Hispanic, or AI/AN students were selected in public schools that were in both the low Black/Hispanic stratum and the low AI/AN stratum for school sampling. Such schools had less than 15 percent (and less than 10) Black/Hispanic students in the sample age, and less than 5 percent (and less than 5) AI/AN students in the sample age. In these schools only, and only if the school E-filed (see next paragraph), a special sampling procedure was implemented that required selecting the Black, Hispanic, and AI/AN students separately from the non-Black, non-Hispanic, non-AI/AN students using two different sampling rates. Within each school, a cap was placed on the sampling rate of the Black, Hispanic, and AI/AN students so that it was no more than twice the sampling rate for the other students. This oversampling was implemented in about 130 public schools.
Within each sampled school, a sample of students was selected from a list of students who were of the targeted age. The student lists were submitted either electronically using a system known as E-filing or on paper. In E-filing, student lists are submitted as Excel files by either School Coordinators, NAEP State Coordinators, or NAEP TUDA Coordinators. The files can be submitted for one school at a time (known as single school E-file submission) or for an entire jurisdiction at once (known as multiple school E- file submission). E-filing allows schools to easily submit student demographic data electronically with the student lists, easing the burden on field supervisors and school coordinators. The E-filing process for 2022 included an additional feature related to age-based sampling. To ease the burden on schools, schools could electronically submit all enrolled students for sampling, rather than just the age-eligible students. Students who were not age-eligible were removed from these lists before sampling.
Schools that are unable to submit their student lists using the E-filing system provide hardcopy lists to NAEP field supervisors. In 2022, about 99 percent of the participating public schools E-filed their student lists, and the remaining one percent submitted hardcopy lists.
In year-round multi-track schools, students in tracks scheduled to be on-break on the assessment day were removed from the student lists prior to sampling. Student base weights were adjusted to account for these students.
The sampling process was the same, regardless of list submission type. The sampling process was systematic (e.g., if the sampling rate was one-half, a random starting point of one or two was chosen, and every other student on the list was selected). For E-filed schools only, where demographic data were submitted for every student in the school, students were sorted by gender and race/ethnicity before the sample was selected to implicitly stratify the sample.
Assigning Assessment Subject to Sampled Students
Sampled students in each participating sampled school were assigned to either mathematics or reading. Within each school, about half of the sampled students were assigned to mathematics and half to reading using a process known as spiraling. In this process, test booklets were randomly assigned to sampled students from booklet sets that had, on average, mathematics to reading spiraling ratios of 1:1.
Similarly to the 2020 long-term trend assessment, for the 2022 assessment, newly identified students (including new enrollees), were not identified and added to the sample. The rationale for this decision was that due to the staggered field periods for the age-based assessment, student lists would be collected closer to assessment day than typically occurs for grade-based assessments.
NAEP Technical Documentation Substitute Public Schools for the 2022 Long-Term Trend Assessment
Substitutes were preselected for the public school samples by sorting the school frame file for each of ages 9 and 13 according to the actual order used in the sampling process (the implicit stratification). For operational reasons, the original selection order was embedded within the sampled primary sampling unit (PSU) and state. Each sampled school had each of its nearest neighbors within the same sampling stratum on the school frame file identified as a potential substitute. Because race/ethnicity percentage was used as the last sort ordering variable, the nearest neighbors had race/ethnicity percentage values very close to that of the sampled school. This helped ensure that expected yields of students in the oversampled race/ethnicity groups were maintained when originally sampled schools were replaced by their substitutes.
Schools were disqualified as potential substitutes if they were already selected in any of the original public school samples or assigned as a substitute for another public school (earlier in the sort ordering).
If both nearest neighbors were still eligible to be substitutes, the one with a closer age enrollment was chosen. If both nearest neighbors were equally distant from the sampled school in their age enrollment (an uncommon occurrence), one of the two was randomly selected.
Of the approximately 410 originally sampled public schools for age 9, about 30 schools had a substitute activated because the original eligible school did not participate, and a handful of those activated substitutes participated. For age 13 the corresponding numbers were approximately 460 originally sampled schools, with approximately 30 substitutes activated. Similar to age 9, only a handlful of activated substitutes participated for age 13.
NAEP Technical Documentation Target Population of the 2022 Public School Long- Term Trend Assessment
The target populations for the 2022 long-term trend public school assessments included all students who were age 9 (i.e., born in 2012) and age 13 (born in 2009) in public schools, Bureau of Indian Education (BIE) schools, and Department of Defense Education Activity (DoDEA) schools located in the 50 states and the District of Columbia.

NAEP Technical Documentation School and Student Participation Results for the 2022 Long-Term Trend Assessment
Participation in NAEP is not mandatory. Although a portion of the participating school sample consisted of substitute schools, it is preferable to calculate school response rates on the basis of school participation before substitution.
In every
NAEP survey,
some of
the sampled
students are
not assessed.
Examples of
such students
are as
follows:
![]() withdrawn students;
withdrawn students;
![]() excluded students
with disabilities
(SD);
excluded students
with disabilities
(SD);
![]() excluded English learner (EL) students;
excluded English learner (EL) students;
![]() students absent
from both
the original
session and
the makeup
session (not
excluded but
not assessed);
or
students absent
from both
the original
session and
the makeup
session (not
excluded but
not assessed);
or
![]() full-time remote students.
full-time remote students.
Withdrawn students are those who have left the school before the original assessment. Excluded students were determined by their school to be unable to meaningfully take the NAEP assessment in their assigned subject, even with an accommodation. Excluded students must also be classified as SD and/or EL. Other students who were absent for the initial session can be assessed in the
School Response Rates for the 2022 Long-Term Trend Assessment
Student Response and Exclusion Rates for the Long-Term Trend Mathematics Assessment
Student Response and Exclusion Rates for the Long-Term Trend Reading Assessment
makeup session. The second-to-the-last category includes students who were not excluded (i.e., were to be assessed) but were not assessed, either due to absence from both sessions or because of a refusal to participate. Full-time remote students are enrolled in brick-and-mortar schools but do not attend school in person. They are considered not assessable for NAEP.
Assessed students are also classified as assessed without an accommodation or assessed with an accommodation. The latter group can be divided into SD students assessed with an accommodation, EL students assessed with an accommodation, or students who are both SD and EL and accommodated. Note that some SD and EL students are assessed without accommodations, and students who are neither SD nor EL can only be assessed without an accommodation.
The weighted student response rates utilize the student base weights and indicate the weighted percentage of assessed students among all students to be assessed. The exclusion rates, in contrast, provide the weighted percentage of excluded SD or EL students among all eligible students, i.e., absent, assessed, and excluded students. The weighted student full-time remote rates provide the weighted percentage of the student population that are full-time remote.
NAEP Technical Documentation School Response Rates for the 2022 Long-Term Trend Assessment
The following table presents counts of eligible sampled schools and participating schools, as well as weighted school response rates, for the 2022 age 9 and 13 long-term trend assessments. The weighted school response rates estimate the proportion of the student population that is represented by the participating school sample prior to substitution.
Eligible and participating school counts and weighted school response rates, long-term trend mathematics and reading assessments, by age, school type, and census region: 2022
-
Age
School type and census region
Number of eligible sampled schools
Number of participating schools
Weighted school response rates prior to substitution (percent)
9
National all1
540
410
85.93
National public
400
370
90.45
Northeast public
60
50
94.29
Midwest public
70
60
76.17
South public
170
170
98.86
West public
100
90
85.64
National private
140
50
32.02
Catholic
40
30
62.73
Non-Catholic
90
20
13.88
1Includes national public, national private, Bureau of Indian Education, and Department of Defense Education Activity schools located in the United States.
NOTE: National public includes students from public schools only. It includes charter schools, but excludes Bureau of Indian Education schools and Department of Defense Education Activity schools. It is used when comparing national data to those of states, urban districts, or regions. School counts are rounded to nearest ten. Detail may not sum to totals because of rounding. Percentages are based on unrounded counts.
SOURCE: U.S. Department of Education, Institute of Education Sciences, National Center for Education Statistics, National Assessment of Educational Progress (NAEP), 2022 Long-Term Trend Assessment.
Age
School type and census region
Number of eligible sampled schools
Number of participating schools
Weighted school response rates prior to substitution (percent)
-
13
National all1
580
460
85.98
National public
440
400
89.81
Northeast public
60
50
86.80
Midwest public
80
70
88.08
South public
190
180
90.99
West public
110
100
91.15
National private
140
60
40.35
Catholic
50
40
82.98
Non-Catholic
90
20
12.54
1Includes national public, national private, Bureau of Indian Education, and Department of Defense Education Activity schools located in the United States. NOTE: National public includes students from public schools only. It includes charter schools, but excludes Bureau of Indian Education schools and Department of Defense Education Activity schools. It is used when comparing national data to those of states, urban districts, or regions. School counts are rounded to nearest ten. Detail may not sum to totals because of rounding. Percentages are based on unrounded counts.
SOURCE: U.S. Department of Education, Institute of Education Sciences, National Center for Education Statistics, National Assessment of Educational Progress (NAEP), 2022 Long-Term Trend Assessment.
NAEP Technical Documentation Student Response and Exclusion Rates for the 2022 Long-Term Trend Mathematics Assessment
The following table presents the weighted student response, exclusion, and full-time remote rates for the 2022 ages 9 and 13 long-term trend mathematics assessments. The exclusion rates give the percentage excluded, among all eligible (i.e., assessed, absent, or excluded) students. Excluded students must be either students with disabilities (SD) or English learners (EL). The response rates indicate the percentage of students assessed among those who it was intended would take the assessment from within the participating schools. Thus, students who were excluded are not included in the denominators of the response rates. The weighted student full-time remote rate indicates the percentage of the student population that is full-time remote (enrolled in brick-and-mortar schools but do not attend school in person).
Weighted student response, exclusion, and full-time remote rates, long-term trend public and private schools, national mathematics assessment, by age, school type, and census region: 2022
-
Age
School type and census region
Weighted student response rates
(percent)
Weighted percentage of all
eligible students who are SD and excluded
Weighted percentage of all
eligible students who are EL and excluded
Weighted student full-time remote
rates (percent)
Age
School type and census region
Weighted student response rates
(percent)
Weighted percentage of all
eligible students who are SD and excluded
Weighted percentage of all
eligible students who are EL and excluded
Weighted student full-time remote
rates (percent)
-
9
National all1
87.08
1.55
0.63
0.71
National public
86.96
1.67
0.68
0.76
Northeast public
82.93
2.50
0.64
0.51
Midwest public
87.88
1.53
0.28
0.64
South public
88.34
1.36
0.48
1.05
West public
86.46
1.77
1.42
0.53
National private
90.42
0.12
#
0.17
Catholic
93.25
0.31
#
0.44
Non-Catholic
84.02
#
#
#
13
National all1
89.11
1.78
1.51
0.31
National public
89.25
1.91
0.96
0.33
Northeast public
85.20
1.48
1.52
0.48
Midwest public
89.47
2.08
0.65
0.37
South public
90.43
1.57
0.55
0.30
West public
89.36
2.61
1.61
0.27
National private
85.77
0.29
#
#
Catholic
85.77
0.73
#
#
Non-Catholic
85.76
#
#
#
1Includes national public, national private, Bureau of Indian Education
, and Department of Defense Educa
tion Activity schools located in the Un
ited States.
NOTE: National public includes students from public schools only. It includes charter schools, but excludes Bureau of Indian Education schools and Department of Defense Education Activity schools. It is used when comparing national data to those of states, urban districts, or regions. SD = students with disabilities; EL = English learners.
SOURCE: U.S. Department of Education, Institute of Education Sciences, National Center for Education Statistics, National Assessment of Educational Progress (NAEP), 2022 Long-Term Trend Mathematics Assessment.
NAEP Technical Documentation Student Response and Exclusion Rates for the 2022 Long-Term Trend Reading Assessment
The following table presents the weighted student response, exclusion, and full-time remote rates for the 2022 ages 9 and 13 long-term-trend reading assessments. The exclusion rates give the percentage excluded, among all eligible (i.e., assessed, absent, or excluded) students. Excluded students must be either students with disabilities (SD) or English learners (EL). The response rates indicate the percentage of students assessed among those who it was intended would take the assessment from within the participating schools. Thus, students who were excluded are not included in the denominators of the response rates. The weighted student full-time remote rate indicates the percentage of the student population that is full-time remote (enrolled in brick-and-mortar schools but do not attend school in person).
Weighted student response, exclusion, and full-time remote rates, long-term trend public and private schools, national reading assessment, by age, school type, and census region: 2022
-
Weighted student
Weighted percentage of all
eligible students
Weighted percentage of all
eligible students
School type and
response rates
Weighted student full-time remote
rates (percent)
Age
census region
(percent)
who are SD and excluded
who are EL and excluded
9
National all1
87.13
1.82
0.90
0.87
National public
87.00
1.96
0.97
0.94
Northeast public
82.18
1.35
0.67
0.98
Midwest public
89.63
0.93
0.53
0.52
South public
87.84
2.26
0.95
1.17
West public
86.82
2.74
1.60
0.87
National private
90.89
0.21
0.01
0.09
Catholic
92.30
0.57
0.02
0.23
Non-Catholic
87.70
#
#
#
13
National all1
89.22
2.44
1.05
0.26
National public
89.28
2.64
1.09
0.28
Northeast public
84.05
3.32
2.08
0.25
Midwest public
89.51
1.59
0.43
0.34
South public
91.24
2.61
0.80
0.24
West public
88.66
3.22
1.60
0.34
National private
87.68
0.17
0.50
#
Catholic
87.16
0.42
#
#
Non-Catholic
89.97
#
0.83
#
1Includes national public, national private, Bureau of India
n Education, and Department of Def
ense Education Activity schools
located in the United States.
NOTE: National public includes students from public schools only. It includes charter schools, but excludes Bureau of Indian Education schools and Department of Defense Education Activity schools. It is used when comparing national data to those of states, urban districts, or regions. SD = students with disabilities; EL = English learners.
SOURCE: U.S. Department of Education, Institute of Education Sciences, National Center for Education Statistics, National Assessment of Educational Progress (NAEP), 2022 Long-Term Trend Reading Assessment.
NAEP Technical Documentation Selection of Primary Sampling Units (PSUs) for the 2022 Assessment
The first stage of sampling for the 2022 assessment was the selection of primary sampling units (PSUs). A PSU is a geographic area comprising an individual county or a group of contiguous counties. One set of 105 PSUs was selected for the 2020 long-term
trend (LTT) assessments. The same set of PSUs used for the 2020 assessments was used for the 2022 LTT assessments.
The PSU samples were drawn using a stratified sample design with one PSU selected per stratum or stratum pair with probability proportional to population size. The size measure used for PSU sampling was persons 17 years of age and younger from 2017 U.S. Census Bureau population estimates.
The PSU sampling frame was constructed by partitioning all counties in the entire United States (the 50 states and the District of Columbia) into 1,001 non-overlapping PSUs as follows:
![]() Each metropolitan
statistical area
(metro area)
was considered
a separate
PSU, unless
it crossed
census region
boundaries. When
this happened, the part within each region was made a separate PSU;
and
Each metropolitan
statistical area
(metro area)
was considered
a separate
PSU, unless
it crossed
census region
boundaries. When
this happened, the part within each region was made a separate PSU;
and
PSU Generation: Metropolitan Statistical Areas
PSU Generation: Certainty PSUs
PSU Generation: Non- Metropolitan Statistical Areas
PSU Frame Stratification Final PSU Samples
![]() Non-metro area
PSUs were
constructed from
contiguous non-metro
area counties
within the
same state
that had
minimum populations
of 15,000
youths in
the Northeast and
South census regions and 10,000 youths in the Midwest and West
census regions.
Non-metro area
PSUs were
constructed from
contiguous non-metro
area counties
within the
same state
that had
minimum populations
of 15,000
youths in
the Northeast and
South census regions and 10,000 youths in the Midwest and West
census regions.
Measures of size for constructing the PSUs were based on youth population data obtained from the 2010 Decennial Census summary files.
For the LTT PSU sample, 29 PSUs on the PSU sampling frame were included in the sample with certainty (selected with a probability of 1). The certainty PSUs constitute the 29 largest metropolitan areas in the United States, and for any national sample to be fully representative it is important to include some schools from each of them.
The remaining PSUs were grouped into noncertainty PSU sampling strata within eight primary strata, which were defined by census region and metropolitan status. The stratification of PSUs within the eight primary strata was based on characteristics shown to be highly correlated with student performance such as race/ethnicity composition, income, education, renter status, and percentage of female-headed households. These data were obtained at the county level from the 2006–2010 American Community Survey (ACS) and then aggregated to the PSU level. Seventy-six noncertainty PSU strata were formed. These PSU strata were then paired to form 38 stratum pairs.
NAEP Technical Documentation Final Primary Sampling Unit (PSU) Samples for the 2022 Assessment
There was one primary sampling unit (PSU) sample for the 2022 Long Term Trend (LTT) assessment, consisting of 105 sample PSUs of which 29 were certainty and 76 were noncertainty. These are the same sampled PSUs used for the 2020 LTT assessment. Using the same PSU sample was necessary in order to maximize overlap between the 2022 LTT school sample and the 2020 LTT school sample.
To select the noncertainty PSUs for the LTT assessments, one PSU was selected from each of the 76 noncertainty strata defined in Final Primary Sampling Unit Strata. Each PSU was selected with probability proportionate to size, where the size measure was the number of persons 17 years of age and younger from the 2017 Census Bureau population estimates.
In addition, to reduce the burden of any particular school when selecting the 2020 sample PSUs, efforts were made to minimize overlap with the 2013, 2014, 2015, 2016, and 2018 PSU samples. This overlap control was facilitated through the careful assignment of the random starts used to select the noncertainty PSUs. There was a small PSU sample that included 32 noncertainty PSUs in 2017, with which overlap control was not attempted. There was no PSU sample for NAEP 2019.
The table below shows the distribution of the 2022 sample PSUs for each assessment by metropolitan status (metropolitan/non-metropolitan), census region, and certainty/metropolitan status.
Distribution of sampled primary sampling units (PSUs) for the long-term trend (LTT) assessments, by metropolitan status, census region, and certainty/metropolitan status: 2022
-
Metropolitan status, census region, or certainty/metropolitan status
Number of sampled PSUs for long-term trend
Total
105
Metropolitan status
Metropolitan
85
Non-metropolitan
20
Census region
Northeast
13
Midwest
23
South
41
West
28
Certainty/metropolitan status
Certainty
29
Non-certainty metropolitan
56
Non-certainty non-metropolitan
20
SOURCE: U.S. Department of Education, Institute of Education Sciences, National Center for Education Statistics, National Assessment of Educational Progress (NAEP), 2022 Long-Term Trend Assessment.
NAEP Technical Documentation Primary Sampling Unit (PSU) Frame Stratification for the 2022 Assessment
The primary sampling unit (PSU) strata were determined by census region and metropolitan status (metropolitan or non- metropolitan) for a total of eight "primary" strata. Measures of size were defined for each of these strata, determined by the relative share of the eventual PSU sample (the sample size is designed to be proportional to the number of youths). The PSU stratum measure of size then is the total number of youths (persons 17 years of age and younger) in the stratum. The table below presents these counts for each of the eight primary strata. The relative share of the PSU sample size for each stratum is the number of youths in the stratum divided by the total number of youths, multiplied by 76 (the total
Stepwise Regression Analysis Results for PSU Stratification
Final PSU Strata
number of noncertainty PSU strata). This is shown in the column entitled "Target number of final PSU strata" in the table below. The resulting number is then rounded to the nearest even integer (the integer needs to be even to facilitate variance estimation). Some manual tweaking to the rounding is needed such that the total number of final PSU strata sums to 76. The results of these calculations are given in the table below.
Noncertainty primary sampling unit frame size statistics, by primary stratum: 2022
-
Primary stratum
PSUs
Counties
Youths
Target number of final PSU
strata
Set number of final PSU
strata
Youths per final PSU
stratum
Total noncertainty PSUs
972
2,901
41,150,742
76
76
541,457
Northeast region metropolitan
43
84
4,353,475
8.0
8
544,184
Northeast region non- metropolitan
48
94
1,021,897
1.9
2
510,949
Midwest region metropolitan
91
229
6,989,571
12.9
12
582,464
Midwest region non- metropolitan
228
762
3,388,214
6.3
6
564,702
South region metropolitan
141
453
13,175,373
24.3
24
548,974
South region non-metropolitan
250
871
5,011,123
9.3
8
626,390
West region metropolitan
68
92
5,553,507
10.3
12
462,792
West region non-metropolitan
103
316
1,657,582
3.1
4
414,396
SOURCE: U.S. Department of Education, Institute of Education Sciences, National Center for Education Statistics, National Assessment of Educational Progress (NAEP), 2022 Long-Term Trend Assessment.
The division of the primary strata into the final strata was done on a stratum-by-stratum basis. The criteria for good PSU strata were 1) the strata should have as nearly equal measures of size as possible (to reduce sampling variance), and 2) the strata should be as heterogeneous in measured achievement as possible (i.e., there should be strata with low mean achievement, strata with mid-level mean achievement, and strata with high mean achievement). This second criterion will also ultimately reduce the variance of the assessment estimates since the final PSU sample will be balanced in terms of assessment means.
PSU assessment means from the current year cannot be used as assessments are only conducted after sampling is completed. Information is available about PSU sociodemographic characteristics in advance, however. An analysis was done within each primary stratum to find sociodemographic variables that were good predictors of performance on the eighth-grade reading assessments conducted in five previous NAEP cycles (2002, 2003, 2005, 2007, and 2009). Using these sociodemographic variables to define final strata should increase the chance of having efficient stratum definitions. Stepwise Regression Analysis Results for PSU Stratification describes this analysis for each primary stratum.
The final step in stratification was to define the desired number of final strata using the selected stratifiers, while constructing final strata that were as close to equal size as possible (with size defined by number of youth). The objective was to establish final strata that had a high between-stratum variance for the stratifiers (i.e., which "spread out" the stratifiers as much as possible). These strata are given in Final PSU Strata.
NAEP Technical Documentation Final Primary Sampling Unit (PSU) Strata for the 2022 Assessment
The strata were defined using the selected stratifiers from the stepwise regression analysis (see Stepwise Regression Analysis Results for PSU Stratification). The cutoffs were selected so that roughly equal measures of size were represented by each stratum.
The number of stratifiers used to define the noncertainty PSU strata within each primary stratum ranged from 1 to 5 stratifiers depending on the size of the primary stratum. For instance, the Northeast non-metropolitan primary stratum, which had about 1 million youths in noncertainty PSUs, used only one stratifier; whereas the South metropolitan primary stratum had about 13 million youths in noncertainty PSUs and used five stratifiers.
The final noncertainty PSU strata are presented in summary tables for each primary PSU stratum. The tables show the definition, number of PSUs, and size of each stratum.
Stratification for Northeast metropolitan noncertainty primary sampling units
Stratification for Northeast non-metropolitan noncertainty primary sampling units
Stratification for Midwest metropolitan noncertainty primary sampling units
Stratification for Midwest non-metropolitan noncertainty primary sampling units
Stratification for South metropolitan noncertainty primary sampling units
Stratification for South non-metropolitan
noncertainty primary sampling units
Stratification for West metropolitan noncertainty primary sampling units
NAEP Technical Documentation Stratification for Midwest
Metropolitan Noncertainty Primary Sampling Units
Stratification for West non-metropolitan noncertainty primary sampling units
The following table provides the definition, number of PSUs, and size of each noncertainty PSU stratum in the Midwest metropolitan primary stratum. Columns 2 through 5 show the characteristics used to define the strata along with their respective cutoffs. The size of each stratum is given in the last column and is in terms of the number of youths (persons 17 years of age and younger).
Stratification for Midwest metropolitan noncertainty primary sampling units (PSUs), by stratum: 2022
-
Stratum
Primary stratifier
Secondary stratifier
Tertiary stratifier
Quaternary stratifier
PSUs
Measure of
size
Total
†
†
†
†
91
6,989,571
1
Percentage of female-headed households <= 9.6
Percentage of female-headed households <= 8.4
†
†
14
613,052
2
Percentage of female-headed households <= 9.6
Percentage of female-headed households > 8.4
†
†
15
599,573
3
Percentage of female-headed households > 9.6
Percentage of renters <= 30.6
Percentage of Black, Hispanic, American Indian/Alaska Native, or Native Hawaiian/Other Pacific Islander
youth <= 14.2
Percentage of Black, Hispanic, American Indian/Alaska Native, or Native Hawaiian/Other Pacific Islander
youth <= 10.1
14
548,336
4
Percentage of female-headed households > 9.6
Percentage of renters <= 30.6
Percentage of Black, Hispanic, American Indian/Alaska Native, or Native Hawaiian/Other Pacific Islander
youth <= 14.2
Percentage of Black, Hispanic, American Indian/Alaska Native, or Native Hawaiian/Other Pacific Islander
youth > 10.1
10
567,571
5
Percentage of female-headed households > 9.6
Percentage of renters <= 30.6
Percentage of Black, Hispanic, American Indian/Alaska Native, or Native Hawaiian/Other Pacific Islander
youth > 14.2
Percentage of Black, Hispanic, American Indian/Alaska Native, or Native Hawaiian/Other Pacific Islander
youth <= 17.6
8
548,156
6
Percentage of female-headed households > 9.6
Percentage of renters <= 30.6
Percentage of Black, Hispanic, American Indian/Alaska Native, or Native Hawaiian/Other Pacific Islander
youth > 14.2
Percentage of Black, Hispanic, American Indian/Alaska Native, or Native Hawaiian/Other Pacific Islander
youth > 17.6
11
552,422
7
Percentage of female-headed households > 9.6
Percentage of renters (30.6-32.2]
Percentage of Black, Hispanic, American Indian/Alaska Native, or Native Hawaiian/Other Pacific Islander
youth <= 16.6
Percentage of female-headed households
<= 12.1
6
562,849
8
Percentage of female-headed households > 9.6
Percentage of renters (30.6-32.2]
Percentage of Black, Hispanic, American Indian/Alaska Native, or Native Hawaiian/Other Pacific Islander
youth <= 16.6
Percentage of female-headed households
> 12.1
3
576,197
9
Percentage of female-headed households > 9.6
Percentage of renters (30.6-32.2]
Percentage of Black, Hispanic, American Indian/Alaska Native, or Native Hawaiian/Other Pacific Islander
youth > 16.6
Percentage of renters <= 31.8
2
639,144
10
Percentage of female-headed households > 9.6
Percentage of renters (30.6-32.2]
Percentage of Black, Hispanic, American Indian/Alaska Native, or Native Hawaiian/Other Pacific Islander
youth > 16.6
Percentage of renters > 31.8
2
582,152
† Not applicable.
SOURCE: U.S. Department of Education, Institute of Education Sciences, National Center for Education Statistics, National Assessment of Educational Progress (NAEP), 2022 Long-Term Trend Assessment.
Stratum Primary stratifier Secondary stratifier Tertiary stratifier Quaternary stratifier PSUs
Measure of
size
-
11
Percentage of female-headed households > 9.6
Percentage of renters > 32.2
Percentage of female-headed households
<= 12.2
†
4
649,462
12
Percentage of female-headed households > 9.6
Percentage of renters > 32.2
Percentage of female-headed households
> 12.2
†
2
550,657
Mean
†
†
†
†
†
582,464
† Not applicable.
SOURCE: U.S. Department of Education, Institute of Education Sciences, National Center for Education Statistics, National Assessment of Educational Progress (NAEP), 2022 Long-Term Trend Assessment.
NAEP Technical Documentation Stratification for Midwest Non-Metropolitan Noncertainty Primary Sampling Units
The following table provides the definition, number of PSUs, and size of each noncertainty PSU stratum in the Midwest non-metropolitan primary stratum. Columns 2 and 3 show the primary and secondary characteristics used to define the strata along with their respective cutoffs. The size of each stratum is given in the last column and is in terms of the number of youths (persons 17 years of age and younger).
Stratification for Midwest non-metropolitan noncertainty primary sampling units (PSUs), by stratum: 2022
-
Stratum
Primary stratifier
Secondary stratifier
PSUs
Measure of
size
Total
†
†
228
3,388,214
1
Percentage of children below the poverty
line <= 16.1
Percentage of children below the poverty line <= 13.7
41
573,682
2
Percentage of children below the poverty
line <= 16.1
Percentage of children below the poverty line > 13.7
36
580,649
† Not applicable.
SOURCE: U.S. Department of Education, Institute of Education Sciences, National Center for Education Statistics, National Assessment of Educational Progress (NAEP), 2022 Long-Term Trend Assessment.
Stratum Primary stratifier Secondary stratifier PSUs
Measure of
size
-
3
Percentage of children below the poverty
line (16.1-20.7]
Percentage of Black, Hispanic, American Indian/Alaska Native, or Native
Hawaiian/Other Pacific Islander youth <= 5.4
38
556,318
4
Percentage of children below the poverty
line (16.1-20.7]
Percentage of Black, Hispanic, American Indian/Alaska Native, or Native
Hawaiian/Other Pacific Islander youth > 5.4
37
560,613
5
Percentage of children below the poverty
line > 20.7
Percentage of children below the poverty line <= 24
38
553,089
6
Percentage of children below the poverty
line > 20.7
Percentage of children below the poverty line > 24
38
563,863
Mean
†
†
†
564,702
† Not applicable.
SOURCE: U.S. Department of Education, Institute of Education Sciences, National Center for Education Statistics, National Assessment of Educational Progress (NAEP), 2022 Long-Term Trend Assessment.
NAEP Technical Documentation Stratification for Northeast Metropolitan Noncertainty Primary Sampling Units
The following table provides the definition, number of PSUs, and size of each noncertainty PSU stratum in the Northeast metropolitan primary stratum. Columns 2 and 3 show the primary and secondary characteristics, respectively, used to define the strata along with their respective cutoffs. The size of each stratum is given in the last column and is in terms of the number of youths (persons 17 years of age and younger).
Stratification for Northeast metropolitan noncertainty primary sampling units (PSUs), by stratum: 2022
-
Stratum
Primary stratifier
Secondary stratifier
PSUs
Measure of size
Total
†
†
43
4,353,475
1
Percentage of female-headed households <= 11
Percentage of female-headed households <= 10.3
10
526,409
2
Percentage of female-headed households <= 11
Percentage of female-headed households > 10.3
7
600,293
3
Percentage of female-headed households (11-11.6]
Percentage of persons aged 25+ who completed high school <=
89.7
7
545,323
† Not applicable.
SOURCE: U.S. Department of Education, Institute of Education Sciences, National Center for Education Statistics, National Assessment of Educational Progress (NAEP), 2022 Long-Term Trend Assessment.
Stratum Primary stratifier Secondary stratifier PSUs Measure of size
-
4
Percentage of female-headed households (11-11.6]
Percentage of persons aged 25+ who completed high school >
89.7
3
518,431
5
Percentage of female-headed households (11.6-
12.7]
Percentage of female-headed households <= 12.5
5
580,767
6
Percentage of female-headed households (11.6-
12.7]
Percentage of female-headed households > 12.5
3
521,663
7
Percentage of female-headed households > 12.7
Percentage of female-headed households <= 13.5
2
554,582
8
Percentage of female-headed households > 12.7
Percentage of female-headed households > 13.5
6
506,007
Mean
†
†
†
544,184
† Not applicable.
SOURCE: U.S. Department of Education, Institute of Education Sciences, National Center for Education Statistics, National Assessment of Educational Progress (NAEP), 2022 Long-Term Trend Assessment.
NAEP Technical Documentation Stratification for Northeast Non-Metropolitan Noncertainty Primary Sampling Units
The following table provides the definition, number of PSUs, and size of each noncertainty PSU stratum in the Northeast non-metropolitan primary stratum. Column 2 shows the primary characteristic used to define the strata along with the cutoffs. The size of each stratum is given in the last column and is in terms of the number of youths (persons 17 years of age and younger).
Stratification for Northeast non-metropolitan noncertainty primary sampling units (PSUs), by stratum: 2022
-
Stratum
Primary stratifier
PSUs
Measure of size
Total
†
48
1,021,897
1
Percentage of persons aged 25+ with a college degree <= 19.1
23
505,650
2
Percentage of persons aged 25+ with a college degree > 19.1
25
516,247
Mean
†
†
510,949
† Not applicable.
SOURCE: U.S. Department of Education, Institute of Education Sciences, National Center for Education Statistics, National Assessment of Educational Progress (NAEP), 2022 Long-Term Trend Assessment.
NAEP Technical Documentation Stratification for South Metropolitan Noncertainty Primary Sampling Units
The following table provides the definition, number of PSUs, and size of each noncertainty PSU stratum in the South metropolitan primary stratum. Columns 2 through 6 show the characteristics used to define the strata along with their respective cutoffs. The size of each stratum is given in the last column and is in terms of the number of youths (persons 17 years of age and younger).
Stratification for South metropolitan noncertainty primary sampling units (PSUs), by stratum: 2022
-
Stratum
Primary stratifier
Secondary stratifier
Tertiary stratifier
Quaternary stratifier
Quinary stratifier
PSUs
Measure of
size
Total
†
†
†
†
†
141
13,175,373
1
Percentage of female-headed households <=
16.9
Percentage of renters <=
33.5
Percentage of Black, Hispanic, American Indian/Alaska Native, or Native Hawaiian/Other Pacific Islander youth <= 28.2
Per capita household income
<= $23,025
Percentage of Black, Hispanic, American Indian/Alaska Native, or Native Hawaiian/Other Pacific Islander youth <=
14.9
14
533,826
2
Percentage of female-headed households <=
16.9
Percentage of renters <=
33.5
Percentage of Black, Hispanic, American Indian/Alaska Native, or Native Hawaiian/Other Pacific Islander youth <= 28.2
Per capita household income
<= $23,025
Percentage of Black, Hispanic, American Indian/Alaska Native, or Native Hawaiian/Other Pacific Islander youth >
14.9
12
509,782
3
Percentage of female-headed households <=
16.9
Percentage of renters <=
33.5
Percentage of Black, Hispanic, American Indian/Alaska Native, or Native Hawaiian/Other Pacific Islander youth <= 28.2
Per capita household income
($23,025-$25,326]
Percentage of female- headed households <= 12.1
6
539,598
† Not applicable.
SOURCE: U.S. Department of Education, Institute of Education Sciences, National Center for Education Statistics, National Assessment of Educational Progress (NAEP), 2022 Long-Term Trend Assessment.
-
Primary
Secondary
Measure of
Stratum
stratifier
stratifier
Tertiary stratifier
Quaternary stratifier
Quinary stratifier
PSUs
size
4
Percentage of female-headed households <=
16.9
Percentage of renters <=
33.5
Percentage of Black, Hispanic, American Indian/Alaska Native, or Native Hawaiian/Other Pacific Islander youth <= 28.2
Per capita household income
($23,025-$25,326]
Percentage of female- headed households >
12.1
6
543,970
5
Percentage of female-headed households <=
16.9
Percentage of renters <=
33.5
Percentage of Black, Hispanic, American Indian/Alaska Native, or Native Hawaiian/Other Pacific Islander youth <= 28.2
Per capita household income
($25,326-$27,540]
Percentage of female- headed households <= 11.8
6
456,746
6
Percentage of female-headed households <=
16.9
Percentage of renters <=
33.5
Percentage of Black, Hispanic, American Indian/Alaska Native, or Native Hawaiian/Other Pacific Islander youth <= 28.2
Per capita household income
($25,326-$27,540]
Percentage of female- headed households >
11.8
3
652,881
7
Percentage of female-headed households <=
16.9
Percentage of renters <=
33.5
Percentage of Black, Hispanic, American Indian/Alaska Native, or Native Hawaiian/Other Pacific Islander youth <= 28.2
Per capita household income
($27,540-$28,621]
†
3
575,617
8
Percentage of female-headed households <=
16.9
Percentage of renters <=
33.5
Percentage of Black, Hispanic, American Indian/Alaska Native, or Native Hawaiian/Other Pacific Islander youth <= 28.2
Per capita household income
> $28,621
†
5
535,472
9
Percentage of female-headed households <=
16.9
Percentage of renters <=
33.5
Percentage of Black, Hispanic, American Indian/Alaska Native, or Native Hawaiian/Other Pacific Islander youth (28.2-30.6]
Percentage of female-headed
households <= 13
†
4
564,610
10
Percentage of female-headed households <=
16.9
Percentage of renters <=
33.5
Percentage of Black, Hispanic, American Indian/Alaska Native, or Native Hawaiian/Other Pacific Islander youth (28.2-30.6]
Percentage of female-headed
households > 13
†
6
545,366
† Not applicable.
SOURCE: U.S. Department of Education, Institute of Education Sciences, National Center for Education Statistics, National Assessment of Educational Progress (NAEP), 2022 Long-Term Trend Assessment.
-
Primary
Secondary
Measure of
Stratum
stratifier
stratifier
Tertiary stratifier
Quaternary stratifier
Quinary stratifier
PSUs
size
11
Percentage of female-headed households <=
16.9
Percentage of renters <=
33.5
Percentage of Black, Hispanic, American Indian/Alaska Native, or Native Hawaiian/Other Pacific Islander youth (30.6-33.2]
Percentage of Black, Hispanic, American Indian/Alaska Native, or Native Hawaiian/Other Pacific Islander youth <= 32.2
†
5
574,325
12
Percentage of female-headed households <=
16.9
Percentage of renters <=
33.5
Percentage of Black, Hispanic, American Indian/Alaska Native, or Native Hawaiian/Other Pacific Islander youth (30.6-33.2]
Percentage of Black, Hispanic, American Indian/Alaska Native, or Native Hawaiian/Other Pacific Islander youth > 32.2
†
2
544,937
13
Percentage of female-headed households <=
16.9
Percentage of renters <=
33.5
Percentage of Black, Hispanic, American Indian/Alaska Native, or Native Hawaiian/Other Pacific
Islander youth > 33.2
Percentage of Black, Hispanic, American Indian/Alaska Native, or Native Hawaiian/Other Pacific Islander youth <= 36.9
†
6
531,652
14
Percentage of female-headed households <=
16.9
Percentage of renters <=
33.5
Percentage of Black, Hispanic, American Indian/Alaska Native, or Native Hawaiian/Other Pacific
Islander youth > 33.2
Percentage of Black, Hispanic, American Indian/Alaska Native, or Native Hawaiian/Other Pacific Islander youth > 36.9
†
6
533,107
15
Percentage of female-headed households <=
16.9
Percentage of renters > 33.5
Per capita household income
<= $23,655
Percentage of renters <= 36.9
†
10
566,668
16
Percentage of female-headed households <=
16.9
Percentage of renters > 33.5
Per capita household income
<= $23,655
Percentage of renters >
36.9
†
11
558,330
17
Percentage of female-headed households <=
16.9
Percentage of renters > 33.5
Per capita household income
($23,655-$26,682]
Percentage of female-headed
households <= 14.2
†
6
576,105
18
Percentage of female-headed households <=
16.9
Percentage of renters > 33.5
Per capita household income
($23,655-$26,682]
Percentage of female-headed
households > 14.2
†
4
566,865
19
Percentage of female-headed
Percentage of renters > 33.5
Per capita household income >
$26,682
Percentage of renters <= 38.7
†
3
540,457
† Not applicable.
SOURCE: U.S. Department of Education, Institute of Education Sciences, National Center for Education Statistics, National Assessment of Educational Progress (NAEP), 2022 Long-Term Trend Assessment.
-
Primary
Stratum stratifier
Secondary
stratifier
Tertiary stratifier
Quaternary stratifier
Quinary stratifier
PSUs
Measure of
size
households <=
16.9

Percentage of female-headed households <=
16.9
Percentage of renters > 33.5
Per capita household income >
$26,682
Percentage of renters >
38.7
† 2 608,592
Percentage of female-headed households >
16.9
Percentage of female-headed households >
16.9
Per capita household income <=
$21,548
Per capita household income <=
$21,548
Percentage of renters <= 31.7 † † 4 560,596
Percentage of renters > 31.7 † † 9 549,613
Percentage of female-headed households >
16.9
Percentage of female-headed households >
16.9
Per capita household income >
$21,548
Per capita household income >
$21,548
Percentage of female-headed
households <= 18.7
Percentage of female-headed
households > 18.7
† † 5 501,582
† † 3 504,676
Mean † † † † † † 548,974
† Not applicable.
SOURCE: U.S. Department of Education, Institute of Education Sciences, National Center for Education Statistics, National Assessment of Educational Progress (NAEP), 2022 Long-Term Trend Assessment.
NAEP Technical Documentation Stratification for South Non-Metropolitan Noncertainty Primary Sampling Units
The following table provides the definition, number of PSUs, and size of each noncertainty PSU stratum in the South non-metropolitan primary stratum. Columns 2 through 4 show the characteristics used to define the strata along with their respective cutoffs. The size of each stratum is given in the last column and is in terms of the number of youths (persons 17 years of age and younger).
Stratification for South non-metropolitan noncertainty primary sampling units (PSUs), by stratum: 2022
-
Stratum
Primary stratifier
Secondary stratifier
Tertiary stratifier
PSUs
Measure of
size
Total
†
†
†
250
5,011,123
1
Percentage of female-headed
households <= 12.6
Per capita household income <= $20,111
Percentage of female- headed households <= 11.3
33
633,594
2
Percentage of female-headed
households <= 12.6
Per capita household income <= $20,111
Percentage of female- headed households > 11.3
33
627,232
3
Percentage of female-headed
households <= 12.6
Per capita household income ($20,111-$22,659]
†
32
645,084
4
Percentage of female-headed
households <= 12.6
Per capita household income > $22,659
†
28
647,245
5
Percentage of female-headed households (12.6-16.2]
Percentage of Black, Hispanic, American Indian/Alaska Native, or Native Hawaiian/Other Pacific Islander youth <= 29.2
†
32
622,008
6
Percentage of female-headed households (12.6-16.2]
Percentage of Black, Hispanic, American Indian/Alaska Native, or Native Hawaiian/Other Pacific Islander youth > 29.2
†
32
633,149
7
Percentage of female-headed
households > 16.2
Per capita household income <= $17,691
†
31
595,547
8
Percentage of female-headed
households > 16.2
Per capita household income > $17,691
†
29
607,264
Mean
†
†
†
†
626,390
† Not applicable.
SOURCE: U.S. Department of Education, Institute of Education Sciences, National Center for Education Statistics, National Assessment of Educational Progress (NAEP), 2022 Long-Term Trend Assessment.
NAEP Technical Documentation Stratification for West Metropolitan Noncertainty Primary Sampling Units
The following table provides the definition, number of PSUs, and size of each noncertainty PSU stratum in the West metropolitan primary stratum. Columns 2 through 4 show the characteristics used to define the strata along with their respective cutoffs. The size of each stratum is given in the last column and is in terms of the number of youths (persons 17 years of age and younger).
Stratification for West metropolitan noncertainty primary sampling units (PSUs), by stratum: 2022
-
Stratum
Primary stratifier
Secondary stratifier
Tertiary stratifier
PSUs
Measure of
size
Total
†
†
†
68
5,553,507
1
Percentage of Black, Hispanic, American Indian/Alaska Native, or Native Hawaiian/Other
Pacific Islander youth <= 18.4
Percentage of renters <=
29.3
†
8
447,020
2
Percentage of Black, Hispanic, American Indian/Alaska Native, or Native Hawaiian/Other
Pacific Islander youth <= 18.4
Percentage of renters
(29.3-31]
†
6
500,321
3
Percentage of Black, Hispanic, American Indian/Alaska Native, or Native Hawaiian/Other
Pacific Islander youth <= 18.4
Percentage of renters > 31
Percentage of persons aged 25+ with a college
degree <= 28.1
10
447,141
4
Percentage of Black, Hispanic, American Indian/Alaska Native, or Native Hawaiian/Other
Pacific Islander youth <= 18.4
Percentage of renters > 31
Percentage of persons aged 25+ with a college
degree > 28.1
9
454,153
5
Percentage of Black, Hispanic, American Indian/Alaska Native, or Native Hawaiian/Other
Pacific Islander youth (18.4-44.3]
Percentage of renters <=
33.6
Percentage of Black, Hispanic, American Indian/Alaska Native, or Native Hawaiian/Other
Pacific Islander youth <= 21
2
519,462
6
Percentage of Black, Hispanic, American Indian/Alaska Native, or Native Hawaiian/Other
Pacific Islander youth (18.4-44.3]
Percentage of renters <=
33.6
Percentage of Black, Hispanic, American Indian/Alaska Native, or Native Hawaiian/Other
Pacific Islander youth > 21
5
429,036
7
Percentage of Black, Hispanic, American Indian/Alaska Native, or Native Hawaiian/Other
Pacific Islander youth (18.4-44.3]
Percentage of renters >
33.6
Percentage of Black, Hispanic, American Indian/Alaska Native, or Native Hawaiian/Other
Pacific Islander youth <= 32.4
7
466,560
8
Percentage of Black, Hispanic, American Indian/Alaska Native, or Native Hawaiian/Other
Pacific Islander youth (18.4-44.3]
Percentage of renters >
33.6
Percentage of Black, Hispanic, American Indian/Alaska Native, or Native Hawaiian/Other
Pacific Islander youth > 32.4
5
474,872
9
Percentage of Black, Hispanic, American Indian/Alaska Native, or Native Hawaiian/Other
Pacific Islander youth (44.3-54.4]
Percentage of renters <=
37.9
†
4
454,868
10
Percentage of Black, Hispanic, American Indian/Alaska Native, or Native Hawaiian/Other
Pacific Islander youth (44.3-54.4]
Percentage of renters >
37.9
†
2
462,254
11
Percentage of Black, Hispanic, American Indian/Alaska Native, or Native Hawaiian/Other
Pacific Islander youth > 54.4
Percentage of persons aged 25+ with a college
degree <= 15.1
†
7
447,696
12
Percentage of Black, Hispanic, American Indian/Alaska Native, or Native Hawaiian/Other
Percentage of persons aged 25+ with a college
†
3
450,124
† Not applicable.
SOURCE: U.S. Department of Education, Institute of Education Sciences, National Center for Education Statistics, National Assessment of Educational Progress (NAEP), 2022 Long-Term Trend Assessment.
Stratum Primary stratifier Secondary stratifier Tertiary stratifier PSUs
Measure of
size
-
Pa
Mean
cific Islander youth > 54.4
†
degree > 15.1
†
†
†
462,792
† Not applicable.
SOURCE: U.S. Department of Education, Institute of Education Sciences, National Center for Education Statistics, National Assessment of Educational Progress (NAEP), 2022 Long-Term Trend Assessment.
NAEP Technical Documentation Stratification for West Non-Metropolitan Noncertainty Primary Sampling Units
The following table provides the definition, number of PSUs, and size of each noncertainty PSU stratum in the West non-metropolitan primary stratum. Columns 2 and 3 show the primary and secondary characteristics, respectively, used to define the strata along with their respective cutoffs. The size of each stratum is given in the last column and is in terms of the number of youths (person 17 years of age and younger).
Stratification for West non-metropolitan noncertainty primary sampling units (PSUs), by stratum: 2022
-
Stratum
Primary stratifier
Secondary stratifier
PSUs
Measure of
size
Total
†
†
103
1,657,582
1
Percentage of female-headed
households <= 9.7
Percentage of Black, Hispanic, American Indian/Alaska Native, or Native
Hawaiian/Other Pacific Islander youth <= 12
27
422,853
2
Percentage of female-headed
households <= 9.7
Percentage of Black, Hispanic, American Indian/Alaska Native, or Native
Hawaiian/Other Pacific Islander youth > 12
28
403,074
3
Percentage of female-headed
households > 9.7
Percentage of female-headed households <= 11.9
26
414,689
4
Percentage of female-headed
households > 9.7
Percentage of female-headed households > 11.9
22
416,966
Mean
†
†
†
414,396
† Not applicable.
SOURCE: U.S. Department of Education, Institute of Education Sciences, National Center for Education Statistics, National Assessment of Educational Progress (NAEP), 2022 Long-Term Trend Assessment.
NAEP Technical Documentation Stepwise Regression Analysis Results for Primary Sampling Unit (PSU) Stratification for the 2022 Assessment
The objective was to find the optimum set of primary sampling unit (PSU)-level sociodemographic characteristics in terms of strength of relationship to achievement. The PSU- level values of these characteristics were derived from the 2010 Decennial Census summary files and the 2006–2010 American Community Survey (ACS) estimates, computed by combining the county-level data (using county youth estimates as the relative weighting factor for each county within the PSU). The characteristics used were as follows:
![]() aggregate race/ethnicity
percentages (percentage
of Black,
Hispanic, American
Indian/Alaska Native,
or Native
Hawaiian/Other Pacific
Islander students);
aggregate race/ethnicity
percentages (percentage
of Black,
Hispanic, American
Indian/Alaska Native,
or Native
Hawaiian/Other Pacific
Islander students);
![]() income levels (per capita household income, percentage of
children below the poverty line);
income levels (per capita household income, percentage of
children below the poverty line);
![]() education levels
in the
population (i.e.,
percentage of
persons aged
25+ who
completed high
school, percentage
of persons
aged 25+
with a
college degree);
education levels
in the
population (i.e.,
percentage of
persons aged
25+ who
completed high
school, percentage
of persons
aged 25+
with a
college degree);
![]() percentage of renters (i.e., percentage of householders who
rent rather than own their place of residence); and
percentage of renters (i.e., percentage of householders who
rent rather than own their place of residence); and
![]() percentage of female-headed households.
percentage of female-headed households.
These PSU-level census characteristics were analyzed with the eighth-grade reading assessment scores from five previous NAEP cycles (2002, 2003, 2005, 2007, and 2009). The criterion was that good strata should be heterogeneous for each of the five characteristics (i.e., within-stratum variance for each assessment value should be low and between-stratum variance high).
The analysis was done separately within each of the eight primary strata (census region and metropolitan status), using a forward stepwise regression approach, with a p- value of .20. The results of the regression model were used to generate the Final PSU Strata.
NAEP Technical Documentation Primary Sampling Unit (PSU) Generation: Certainty PSUs for the 2022 Assessment
Any primary sampling unit (PSU) was defined as a certainty PSU if it had 500,000 or more youths or if it represented more than 80 percent of its assigned stratum. The estimated number of youths used to designate certainty PSUs was the number of persons aged 17 or under from the 2010 Decennial Census. These PSUs were so large that a sample of schools was taken from all of them (rather than from only a subsample of them, as with noncertainty PSUs). The Honolulu, Hawaii PSU was included as certainty by
design in order to reduce the variances of estimates for Asian and Native Hawaiian/Other Pacific Islander students. A total of 29 PSUs were classified as certainties in the
PSU frame. The table below provides a listing of the certainty PSUs by census region. Note that the names of the metropolitan statistical areas do not represent the cities proper. Rather they can and do cross jurisdiction and county boundaries (for example, the Boston-Cambridge-Quincy metropolitan statistical area includes Massachusetts and New Hampshire). The "Number of youths" column in the table reflects updated 2017 U.S. Census Bureau population estimates.
Metropolitan statistical area definitions for certainty PSUs, by census region: 2022
-
Census region/Metropolitan statistical area
Jurisdiction
Number of counties
Number of youths
Total
†
241
32,504,636
Northeast
†
39
6,372,003
Boston-Cambridge-Quincy
MA-NH
7
964,952
New York-Northern New Jersey-Long Island
NY-NJ-PA
23
4,222,175
Philadelphia-Camden-Wilmington (Northeast part)
PA-NJ
9
1,184,876
Midwest
†
64
5,149,811
Chicago-Joliet-Naperville
IL-IN-WI
14
2,192,226
Detroit-Warren-Livonia
MI
6
960,673
Kansas City
MO-KS
15
526,178
Minneapolis-St. Paul-Bloomington
MN-WI
13
838,824
St. Louis
MO-IL
16
631,910
South
†
98
10,318,929
Atlanta-Sandy Springs-Marietta
GA
28
1,451,162
Baltimore-Towson
MD
7
616,336
Dallas-Fort Worth-Arlington
TX
12
1,926,790
Houston-Sugar Land-Baytown
TX
10
1,850,453
Miami-Fort Lauderdale-Pompano Beach
FL
3
1,252,616
Orlando-Kissimmee-Sanford
FL
4
553,844
San Antonio-New Braunfels
TX
8
629,757
Tampa-St. Petersburg-Clearwater
FL
4
623,162
Washington-Arlington-Alexandria
DC-VA-MD-WV
22
1,414,809
West
†
40
10,663,893
Denver-Aurora-Broomfield
CO
10
659,646
Honolulu
HI
1
209,809
Las Vegas-Paradise
NV
1
514,192
Los Angeles-Long Beach-Santa Ana
CA
2
2,930,904
Phoenix-Mesa-Glendale
AZ
2
1,144,270
Portland-Vancouver-Hillsboro
OR-WA
7
533,626
Riverside-San Bernardino-Ontario
CA
2
1,187,880
† Not applicable.
SOURCE: U.S. Department of Education, Institute of Education Sciences, National Center for Education Statistics, National Assessment of Educational Progress (NAEP), 2022 Long-Term Trend Assessment.
Census region/Metropolitan statistical area Jurisdiction Number of counties Number of youths
-
Sacramento--Arden-Arcade--Roseville
CA
4
534,664
San Diego-Carlsbad-San Marcos
CA
1
728,528
San Francisco-Oakland-Fremont
CA
5
938,267
San Jose-Sunnyvale-Santa Clara
CA
2
445,589
Seattle-Tacoma-Bellevue
WA
3
836,518
† Not applicable.
SOURCE: U.S. Department of Education, Institute of Education Sciences, National Center for Education Statistics, National Assessment of Educational Progress (NAEP), 2022 Long-Term Trend Assessment.
NAEP TechnicaL Documentation Primary Sampling Unit (PSU) Generation: Metropolitan Statistical Areas for the 2022 Assessment
Primary Sampling Units (PSUs) for NAEP are classified as either metropolitan statistical areas1 (metro areas) or non-metro areas. Each metro area constitutes a separate PSU, except when it crosses census region boundaries. Such metro areas are split along regional boundaries with each regional part considered its own distinct PSU. For example, the Louisville-Jefferson County, KY-IN metro area was partitioned into two PSUs, one for the counties in Kentucky which are part of the South region and the other for counties in Indiana which are part of the Midwest region.
In total, there were 372 metro area PSUs, 29 of which were defined as certainty PSUs. The remaining 343 metro area PSUs, covering a total of 858 counties, constituted the noncertainty portion of the metro area PSU sampling frame. The estimated number of youths used to define certainty and noncertainty PSUs was the number of persons aged 17 or under from the 2010 Decennial Census. The table below presents the number of PSUs, the number of counties represented, and the updated estimated number of youths (total and mean per PSU) in noncertainty metro area PSUs by census region. These updated estimates come from the county-level estimates of numbers of persons aged 0 to 17 from the 2017 U.S. Census Bureau population estimates.
Noncertainty metropolitan primary sampling unit (PSU) frame, by census region: 2022
-
Census region
PSUs
Counties
Youths
Mean number of youths per PSU
Total
343
858
30,071,926
87,673
Northeast
43
84
4,353,475
101,244
Midwest
91
229
6,989,571
76,808
South
141
453
13,175,373
93,442
SOURCE: U.S. Department of Education, Institute of Education Sciences, National Center for Education Statistics, National Assessment of Educational Progress (NAEP), 2022 Long-Term Trend Assessment.
West
68
92
5,553,507
81,669
SOURCE: U.S. Department of Education, Institute of Education Sciences, National Center for Education Statistics, National Assessment of Educational Progress (NAEP), 2022 Long-Term Trend Assessment.
1 Based on the 2009 metro area definitions, the most recent available metro area definitions at the time of PSU construction, from the U.S. Office of Management and Budget (OMB Bulletin No. 10-02).
NAEP Technical Documentation Primary Sampling Unit (PSU) Generation: Non- Metropolitan Statistical Areas for the 2022 Assessment
Primary Sampling Units (PSUs) for NAEP are classified as either metropolitan statistical areas1 (metro areas) or non-metro areas. Non-metro area PSUs are PSUs that are made up of counties that are not part of any metropolitan statistical areas.
An algorithm was used to define a preliminary set of non-metro area PSUs satisfying specific design constraints. The algorithm attempted to form PSUs that were geographically compact, of a minimum population size based on 2010 Decennial Census estimates (15,000 youths in the Northeast and South census regions, and 10,000 youths in the Midwest and West census regions) and that also did not cross state boundaries. The input set consisted of all non-metro area counties. The county which had the largest maximum point-to-point distance was addressed first. It was grouped with adjacent non-metro area counties until the minimum PSU size was met. The algorithm was then run on the remaining non-metro area counties not yet assigned to a PSU to combine the county with the largest maximum point-to-point distance among the remaining counties with its adjacent non-metro area counties until the minimum PSU size was met. This process was repeated until all counties were grouped into PSUs.
When the algorithm was unable to create PSUs that conformed to the specific design constraints, manual adjustments were made. The end result of this procedure was that all non-metro area PSUs were contained within state boundaries, but in some cases the PSU size fell slightly below the pre-specified minimum.
In total, there were 629 non-metro area PSUs covering a total of 2,043 counties, all of which constitute the non-metro area PSU sampling frame. The table below presents the number of PSUs, the number of counties represented, and the updated estimated number of youths (total and mean per PSU) in the non-metro area PSU sampling frame by census region. The updated estimated number of youths (persons aged 0 to 17) for each county comes from the 2017 U.S. Census Bureau population estimates.
Non-metropolitan statistical area primary sampling unit (PSU) frame, by census region: 2022
-
Census region
PSUs
Counties
Youths
Mean number of youths per PSU
Total
629
2,043
11,078,816
17,613
SOURCE: U.S. Department of Education, Institute of Education Sciences, National Center for Education Statistics, National Assessment of Educational Progress (NAEP), 2022 Long-Term Trend Assessment.
-
Northeast
48
94
1,021,897
21,290
Midwest
228
762
3,388,214
14,861
South
250
871
5,011,123
20,044
West
103
316
1,657,582
16,093
SOURCE: U.S. Department of Education, Institute of Education Sciences, National Center for Education Statistics, National Assessment of Educational Progress (NAEP), 2022 Long-Term Trend Assessment.
1 Based on the 2009 metro area definitions, the most recent available metro area definitions at the time of PSU construction, from the U.S. Office of Management and Budget (OMB Bulletin No. 10-02).
NAEP Technical Documentation Sample Design for the 2022 State Assessment
The NAEP 2022 state assessment sampled jurisdictions comprising the 50 states, the District of Columbia, Puerto Rico, Bureau of Indian Education (BIE) schools, Department of Defense Education Activity (DoDEA) schools, and school districts participating in the Trial Urban District Assessment (TUDA). Each sample, with the exception of BIE schools, was designed to produce aggregate estimates with approximately equal precision for all the participating jurisdictions, as well as estimates for various student populations of interest. In 2022, by design BIE was not a reportable jurisdiction. However, to ensure that there were sufficient numbers of American Indian
or Alaska Native (AI/AN) students at the national level, a small number of BIE schools were included in the sample.
The target population for the NAEP 2022 state assessments covered fourth- and eighth-grade students in public schools who were enrolled in grades 4 and 8 at the time of assessment. Operational mathematics and reading assessments were conducted in all jurisdictions, including the TUDA districts, with the exception of Puerto Rico, where only the operational mathematics assessment was conducted.
The state samples were selected to have maximum overlap with the school samples for the NAEP 2021 Monthly School Survey and the NAEP 2021 School and Teacher Questionnaire Study. This overlap control was achieved for these samples by using an adaptation of the Keyfitz process.
Target Population Sampling Frame Stratification of Schools School Sample Selection Ineligible Schools Student Sample Selection
School and Student Participation
The overall target student sample size for the operational samples in each non-TUDA jurisdiction, with the exception of Puerto Rico, was 4,100 at grade 4 and 4,200 at grade 8. The goal at each grade was to obtain 3,500 assessed students after attrition: 1,750 for mathematics and 1,750 for reading. For the operational mathematics assessment in Puerto Rico, the target student sample size was 3,600 for both grades, with the goal of assessing 3,000 students after attrition.
The primary sampling frame for each grade included public schools having the relevant grade in each jurisdiction. The samples were selected based on a two-stage sample design:
![]() selection of
schools within
participating
jurisdictions; and
selection of
schools within
participating
jurisdictions; and
![]() selection of students within schools.
selection of students within schools.
The first-stage samples of schools were selected with probability proportional to a measure of size based on the estimated grade-specific enrollment in the schools.
The sampling of students at the second stage involved two steps: (1) sampling of students in the targeted grade (fourth or eighth) from each sampled school, and (2) assignment of assessment subject (mathematics or reading) to the sampled students.
For the TUDA samples, schools were sampled from the 26 participating TUDA districts at the same time schools were selected for the non-TUDA jurisdiction samples. The participating TUDA districts are listed below:
![]() Albuquerque Public
Schools, New
Mexico;
Albuquerque Public
Schools, New
Mexico;
![]() Atlanta Public Schools, Georgia;
Atlanta Public Schools, Georgia;
![]() Austin Independent
School District,
Texas;
Austin Independent
School District,
Texas;
![]() Baltimore City Public Schools, Maryland;
Baltimore City Public Schools, Maryland;
![]() Boston Public Schools, Massachusetts;
Boston Public Schools, Massachusetts;
![]() Charlotte-Mecklenburg
Schools, North
Carolina;
Charlotte-Mecklenburg
Schools, North
Carolina;
![]() Chicago Public Schools, Illinois;
Chicago Public Schools, Illinois;
![]() Clark County School District, Nevada;
Clark County School District, Nevada;
![]() Cleveland Metropolitan
School District,
Ohio;
Cleveland Metropolitan
School District,
Ohio;
![]() Dallas Independent School District, Texas;
Dallas Independent School District, Texas;
![]() Denver Public
Schools, Colorado;
Denver Public
Schools, Colorado;
![]() Detroit Public
Schools, Michigan;
Detroit Public
Schools, Michigan;
![]() District of
Columbia Public
Schools, District
of Columbia;
District of
Columbia Public
Schools, District
of Columbia;
![]() Duval County Public Schools, Florida;
Duval County Public Schools, Florida;
![]() Fort Worth
Independent School
District, Texas;
Fort Worth
Independent School
District, Texas;
![]() Guilford County Schools, North Carolina;
Guilford County Schools, North Carolina;
![]() Hillsborough County
Public Schools,
Florida;
Hillsborough County
Public Schools,
Florida;
![]() Houston Independent School District,
Texas;
Houston Independent School District,
Texas;
![]() Jefferson County Public Schools, Kentucky;
Jefferson County Public Schools, Kentucky;
![]() Los Angeles
Unified School
District, California;
Los Angeles
Unified School
District, California;
![]() Miami-Dade County Public Schools, Florida;
Miami-Dade County Public Schools, Florida;
![]() Milwaukee Public Schools, Wisconsin;
Milwaukee Public Schools, Wisconsin;
![]() New York
City Department
of Education,
New York;
New York
City Department
of Education,
New York;
![]() San Diego Unified School District, California;
San Diego Unified School District, California;
![]() School District
of Philadelphia,
Pennsylvania; and
School District
of Philadelphia,
Pennsylvania; and
![]() Shelby County Schools, Tennessee.
Shelby County Schools, Tennessee.
These subsamples affected the design of the state samples in those states where TUDA districts were oversampled. In each of these states, there were distinct sampling rates for each TUDA district and for the balance of the state (i.e., the rest of the state not in a TUDA district). For the six large TUDA districts (i.e., New York, Los Angeles, Chicago, Miami-Dade, Clark County, and Houston) the target assessed student sample size for the operational samples was three-quarters the size of the non-TUDA jurisdictions: 2,625 per grade (i.e., 1,313 per subject for each grade). For the remaining TUDA districts, the target assessed student sample size for the operational samples was half the size of the state sample: 1,750 per grade (i.e., 875 per subject for each grade).
Each selected school provided a list of eligible enrolled students from which a systematic sample of students was drawn. In fourth- and eighth-grade schools, 50 students, if possible, were selected from each school: roughly 25 for mathematics and 25 for reading. In some very large schools, multiples of 50 students (i.e., 100, 150, etc.) were selected. Details can be found on the student sample selection page.
NAEP Technical Documentation Ineligible Schools for the 2022 State Assessment
The Common Core of Data (CCD)-based sampling frames, from which most of the sampled schools were drawn, corresponds to the 2019–2020 school year, two years prior to the assessment school year. During the intervening period, some of these schools either closed, no longer offered the grade of interest, or were ineligible for other reasons. In such cases, the sampled school was coded as ineligible.
Total and Eligible Schools Sampled Eligibility Status of Schools Sampled
NAEP Technical Documentation Eligibility Status of Schools Sampled for the 2022 State Assessment
The following table shows the unweighted counts and percentages of sampled schools that were eligible and ineligible, by reason for ineligibility, for the fourth- and eighth- grade public school state assessment samples.
Sampled schools, state assessment, by grade and eligibility status: 2022
-
Grade 4
Grade 8
Eligibility status
Unweighted count of
schools
Unweighted percentage
Unweighted count of
schools
Unweighted percentage
All sampled public schools
6,010
100.00
5,490
100.00
Eligible
5,830
96.99
5,250
95.70
Ineligible
181
3.01
236
4.30
Has sampled grade, but no eligible students
22
0.37
23
0.42
Does not have sampled grade
48
0.80
59
1.07
NOTE: Numbers of schools are rounded to nearest ten, except those pertaining to ineligible schools. Detail may not sum to totals due to rounding. Percentages are based on unrounded counts.
SOURCE: U.S. Department of Education, Institute of Education Sciences, National Center for Education Statistics, National Assessment of Educational Progress (NAEP), 2022 State Mathematics and Reading Assessments.
 Grade
4 Grade
8
Grade
4 Grade
8
Eligibility status
Unweighted count of
schools
Unweighted percentage
Unweighted count of
schools
Unweighted percentage
-
School closed
51
0.85
51
0.93
Not a regular school
52
0.87
81
1.48
Other ineligible school
8
0.13
22
0.40
Duplicate on sampling frame
0
0
0
0
NOTE: Numbers of schools are rounded to nearest ten, except those pertaining to ineligible schools. Detail may not sum to totals due to rounding. Percentages are based on unrounded counts.
SOURCE: U.S. Department of Education, Institute of Education Sciences, National Center for Education Statistics, National Assessment of Educational Progress (NAEP), 2022 State Mathematics and Reading Assessments.
NAEP Technical Documentation Total and Eligible Sampled Schools for the 2022 State Assessment
The following table presents the numbers of total and eligible fourth- and eighth-grade schools sampled for each NAEP 2022 state assessment jurisdiction.
Total and eligible sampled schools, state assessment, by grade and jurisdiction: 2022
-
Jurisdiction
Grade 4
Grade 8
Total school sample
Eligible school sample
Total school sample
Eligible school sample
Total
6,010
5,830
5,490
5,250
Alabama
90
90
90
90
Alaska
130
130
110
100
Arizona
90
90
90
90
Arkansas
90
80
90
90
California–Los Angeles
60
60
60
60
California–San Diego
40
40
40
30
California–Balance
80
80
80
70
Colorado–Denver
40
40
40
40
NOTE: Numbers of schools rounded to nearest ten. Detail may not sum to totals due to rounding.
SOURCE: U.S. Department of Education, Institute of Education Sciences, National Center for Education Statistics, National Assessment of Educational Progress (NAEP), 2022 State Mathematics and Reading Assessments.
-
Colorado–Balance
80
80
80
70
Connecticut
90
80
90
80
Delaware
80
70
50
50
Florida–Duval County
40
40
40
40
Florida–Hillsborough County
40
40
40
40
Florida–Miami-Dade County
60
60
70
60
Florida–Balance
60
60
70
70
Georgia–Atlanta
40
40
30
30
Georgia–Balance
80
80
80
80
Hawaii
90
90
50
50
Idaho
90
90
90
80
Illinois–Chicago
70
70
70
70
Illinois–Balance
80
70
70
70
Indiana
90
90
90
80
Iowa
90
90
90
80
Kansas
100
100
90
90
Kentucky–Jefferson County
40
40
30
20
Kentucky–Balance
70
70
80
70
Louisiana
90
80
90
90
Maine
110
110
90
90
Maryland–Baltimore
50
40
50
40
Maryland–Balance
80
80
80
80
Massachusetts–Boston
50
50
50
40
Massachusetts–Balance
80
80
80
80
Michigan–Detroit
40
40
40
40
Michigan–Balance
90
80
90
90
Minnesota
90
90
100
80
Mississippi
90
90
90
80
Missouri
100
90
100
90
Montana
130
120
100
100
Nebraska
100
100
100
100
Nevada–Clark County
60
60
50
50
Nevada–Balance
30
30
30
30
New Hampshire
100
100
80
80
-
New Jersey
90
90
90
90
New Mexico–Albuquerque
40
40
40
30
New Mexico–Balance
70
70
70
70
New York–New York City
70
70
70
70
New York–Balance
60
50
60
60
North Carolina–Charlotte
40
40
30
30
North Carolina–Guilford County
40
40
30
20
North Carolina–Balance
80
70
80
70
North Dakota
120
120
90
80
Ohio–Cleveland
50
50
50
50
Ohio–Balance
90
80
90
80
Oklahoma
100
90
90
90
Oregon
90
90
90
90
Pennsylvania–Philadelphia
40
40
40
40
Pennsylvania–Balance
80
80
80
80
Rhode Island
90
90
60
60
South Carolina
90
90
90
90
South Dakota
120
120
100
90
Tennessee–Shelby County
40
40
40
40
Tennessee–Balance
80
80
80
80
Texas–Austin
40
40
20
20
Texas–Dallas
40
40
40
40
Texas–Fort Worth
40
40
30
20
Texas–Houston
60
60
40
40
Texas–Balance
80
80
80
80
Utah
90
80
90
90
Vermont
130
130
90
90
Virginia
90
80
90
80
Washington
90
90
90
90
West Virginia
100
100
90
90
Wisconsin–Milwaukee
50
50
40
40
Wisconsin–Balance
90
80
80
80
Wyoming
100
100
70
60
Other jurisdictions
-
Bureau of Indian Education (BIE)
10
10
10
10
Department of Defense Education Activity (DoDEA)
100
90
60
50
District of Columbia (TUDA)
50
50
30
20
District of Columbia–Balance
40
30
50
40
Puerto Rico
150
150
150
150
NOTE: Numbers of schools rounded to nearest ten. Detail may not sum to totals due to rounding.
SOURCE: U.S. Department of Education, Institute of Education Sciences, National Center for Education Statistics, National Assessment of Educational Progress (NAEP), 2022 State Mathematics and Reading Assessments.
NAEP Technical Documentation Sampling Frame for the 2022 State Assessment
The primary sampling frames for the 2022 fourth- and eighth-grade public school samples for the state assessments in mathematics and reading were developed from the Common Core of Data (CCD) file corresponding to the 2019–2020 school year. The CCD file is the Department of Education’s primary database of public elementary and secondary schools in the United States including U.S. territories. It includes all regular public, state-operated public, Bureau of Indian Education (BIE), and Department of Defense Education Activity (DoDEA) schools open during the 2019–2020 school year. These sampling frames are referred to as the CCD-based sampling frames.
Fourth- and Eighth-Grade Schools and Enrollment
New-School Sampling Frame
A secondary set of sampling frames were also created for these fourth- and eighth-grade samples to account for schools that newly opened or became newly eligible between the 2019–2020 and 2021–2022 school years. These frames contain brand-new and newly-eligible fourth- and eighth-grade schools and are referred to as the new-school sampling frames.
Both sets of sampling frames excluded ungraded schools, vocational schools with no enrollment, special-education-only schools, prison and hospital schools, home school entities, virtual or online schools, adult and evening schools, and juvenile correctional institutions. Vocational schools with no enrollment serve students who split their time between the vocational school and their home school.
NAEP Technical Documentation Fourth- and Eighth-Grade Schools and Enrollment in the 2022 State Assessment Sampling Frame
The following table presents the number of fourth- and eighth-grade public schools and their estimated enrollment, as contained in the Common Core of Data (CCD)-based sampling frames, by jurisdiction, for the state mathematics and reading assessments. Grade 4 or grade 8 enrollment was estimated for each school as the average of the per- grade enrollments for grades 1 through 8, counting only the grades in that range that were offered by the school.
Number of schools and enrollment in public school sampling frame, state assessment, by grade and jurisdiction: 2022
-
Grade 4
Grade 8
Jurisdiction
Schools
Enrollment
Schools
Enrollment
Total
52,248
3,750,123
29,665
3,870,570
Alabama
689
56,232
436
56,217
Alaska
346
9,155
266
9,202
Arizona
1,230
86,152
830
88,080
Arkansas
474
37,099
304
37,124
California–Los Angeles
497
38,919
126
33,124
California–San Diego
121
8,247
38
7,036
California–Balance
5,517
407,176
2,932
425,888
Colorado–Denver
110
6,823
62
6,571
Colorado–Balance
989
59,308
552
62,168
Connecticut
559
37,280
289
39,376
Delaware
117
10,511
68
11,041
Florida–Duval County
124
10,577
60
9,784
Florida–Hillsborough County
189
17,620
100
16,814
Florida–Miami
287
25,525
190
26,991
Florida–Balance
1,690
161,932
952
166,395
Georgia–Atlanta
56
4,443
26
3,914
Georgia–Balance
1,196
126,156
557
134,401
Hawaii
208
14,325
84
13,911
Idaho
393
23,634
219
24,793
Illinois–Chicago
459
26,029
454
26,680
Illinois–Balance
1,762
113,320
1,144
121,781
Indiana
1,033
77,755
490
80,844
Iowa
614
36,402
357
38,428
Kansas
695
35,714
392
37,025
SOURCE: U.S. Department of Education, Institute of Education Sciences, National Center for Education Statistics, National Assessment of Educational Progress (NAEP), 2022 State
Assessment.
Kentucky–Jefferson County
99
7,443
41
7,425
Kentucky–Balance
625
42,954
390
45,001
Louisiana
739
53,725
499
53,361
Maine
309
13,041
198
13,472
Maryland–Baltimore
116
6,420
88
5,373
Maryland–Balance
776
62,293
283
62,434
Massachusetts–Boston
70
3,621
46
3,676
Massachusetts–Balance
881
65,102
446
68,558
Michigan–Detroit
72
4,164
59
3,362
Michigan–Balance
1,605
100,469
1,043
107,587
Minnesota
990
65,135
730
67,317
Mississippi
407
35,543
278
36,803
Missouri
1,163
67,268
712
70,194
Montana
394
11,721
277
11,939
Nebraska
511
23,867
290
23,444
Nevada–Clark County
237
23,890
76
25,352
Nevada–Balance
197
13,277
118
13,456
New Hampshire
269
12,854
151
13,626
New Jersey
1,362
96,698
789
100,973
New Mexico–Albuquerque
102
6,704
46
6,493
New Mexico–Balance
336
17,887
190
18,904
New York–New York City
820
67,351
512
66,309
New York–Balance
1,700
127,280
1,035
131,020
North Carolina–Charlotte
111
11,430
45
11,436
North Carolina–Guilford County
73
5,440
29
5,497
North Carolina–Balance
1,322
101,198
710
105,409
North Dakota
264
9,116
180
8,823
Ohio–Cleveland
80
3,265
78
3,179
Ohio–Balance
1,587
122,148
983
127,080
Oklahoma
840
51,807
588
52,202
Oregon
754
43,807
419
45,433
Pennsylvania–Philadelphia
147
10,490
120
9,339
Pennsylvania–Balance
1,396
117,460
769
124,275
Rhode Island
166
10,460
63
10,922
SOURCE: U.S. Department of Education, Institute of Education Sciences, National Center for Education Statistics, National Assessment of Educational Progress (NAEP), 2022 State Assessment.
-
South Carolina
656
58,707
318
59,887
South Dakota
314
10,725
252
11,013
Tennessee–Shelby County
119
8,885
62
7,965
Tennessee–Balance
906
67,289
551
68,972
Texas–Austin
81
6,112
21
5,558
Texas–Dallas
148
11,497
41
10,336
Texas–Fort Worth
85
6,196
33
6,049
Texas–Houston
176
16,509
60
13,143
Texas–Balance
4,124
359,068
2,204
380,080
Utah
650
51,190
275
53,345
Vermont
208
5,916
116
5,867
Virginia
1,110
96,163
383
99,765
Washington
1,256
84,888
631
86,202
West Virginia
387
19,055
180
19,653
Wisconsin–Milwaukee
112
5,563
79
4,964
Wisconsin–Balance
969
53,828
568
56,942
Wyoming
187
7,286
91
7,664
Other jurisdictions
Bureau of Indian Education (BIE)
136
3,066
110
2,742
Department of Defense Education Activity (DoDEA)
89
5,708
60
4,671
District of Columbia (TUDA)
79
4,034
32
3,013
District of Columbia–Balance
50
2,573
44
2,624
Puerto Rico
531
20,203
345
22,853
SOURCE: U.S. Department of Education, Institute of Education Sciences, National Center for Education Statistics, National Assessment of Educational Progress (NAEP), 2022 State Assessment.
NAEP Technical Documentation New-School Sampling Frame for the 2022 State Assessment
The primary sampling frames for the 2022 fourth- and eighth-grade public school samples for the state assessment in mathematics and reading were constructed using the most current Common Core of Data (CCD) file available from NCES. This file contained schools that were in existence during the 2019-2020 school year (i.e., it was two years out of date). During the subsequent 2-year period, undoubtedly some schools closed, some changed structure (one school becoming two schools, for example), some newly opened, and still others changed their grade span.
A supplemental sample was selected from a list of schools that were new or had become newly eligible sometime after the 2019–2020 school year. The goal was to allow every new school a chance of selection, thereby fully covering the target population of schools in operation during the 2021–2022 school year. It was infeasible to ask every school district in the United States to provide a supplemental school frame, so a two-stage procedure was employed. First, a sample of school districts was selected within each state. Then each State or Trial Urban District Assessment (TUDA) Coordinator was sent a list of the schools within their sampled districts that had been present on the 2019–
2020 CCD file. The Coordinators were asked to add in any new schools and update grade span for the schools on this list.
The new-school process began with the preparation of a district-level frame. The starting point was a file containing every public school district in the United States. Specific districts were designated as in sample with certainty. They included the following districts:
![]() districts in
jurisdictions where
all schools
were selected
for sample
at either
grade 4
or 8;
districts in
jurisdictions where
all schools
were selected
for sample
at either
grade 4
or 8;
![]() state-operated districts;
state-operated districts;
![]() districts in states with fewer than 10 districts;
districts in states with fewer than 10 districts;
![]() charter-only districts
(that is,
districts containing
no schools
other than
charter schools);
and
charter-only districts
(that is,
districts containing
no schools
other than
charter schools);
and
![]() TUDA districts.
TUDA districts.
Then noncertainty districts were classified as small, medium, or large based on the number of schools and student enrollment of schools from the CCD-based public school frame.
A district was considered to be small if it contained no more than one school at each targeted grade (4 and 8). During school recruitment, the Coordinators were asked to identify schools within their district that newly offered the targeted grade. Every identified new school was added to the sample. From a sampling perspective, the new school was viewed as an “annex” to the sampled school which meant that it had a well-defined probability of selection equal to that of the sampled school. When a school in a small district was sampled from the CCD-based frame, its associated new school was automatically sampled as well.
Within each jurisdiction, districts that were neither certainty selections nor small were divided into two strata, one containing large-size districts and a second containing medium-size districts. These strata were defined by computing the percentage of jurisdiction grade 4 and 8 enrollment represented by each district, sorting in descending order, and cumulating the percentages. All districts up to and including the first district at or above the 80th cumulative percentage were defined as large districts. The remaining districts were defined as medium districts.
A simplified example is given below. The state's districts are ordered by descending percentage enrollment. The first six become large districts and the last six become medium districts.
Large-size and medium-size district strata example, by enrollment, stratum, and district, 2022
-
District
Percentage enrollment
Cumulative percentage enrollment
Stratum
1
20
20
L
2
20
40
L
3
15
55
L
District Percentage enrollment Cumulative percentage enrollment Stratum
-
4
10
65
L
5
10
75
L
6
10
85
L
7
5
90
M
8
2
92
M
9
2
94
M
10
2
96
M
11
2
98
M
12
2
100
M
SOURCE: U.S. Department of Education, Institute of Education Sciences, National Center for Education Statistics, National Assessment of Educational Progress (NAEP), 2022 State Mathematics and Reading Assessments.
The target sample size for each jurisdiction was 10 districts total across the medium-size and large-size district strata. Where possible, eight districts were selected from the large-size district stratum and two districts from the medium-size district stratum. However, in the example above, since there are only six large districts, all of the districts in the large district stratum and four districts from the medium district stratum would have been selected for the new-school inquiry.
If sampling was needed in the medium-size district stratum, districts in this stratum were selected with equal probability. If sampling was needed in the large-size district stratum, the districts in this stratum were sampled with probability proportional to enrollment. These probabilities were retained and used in later stages of sampling and weighting of new schools.
The selected districts in each jurisdiction were then sent a listing of all their schools that appeared on the 2019–2020 CCD file and were asked to provide information about the new schools not included in the file and grade span changes of existing schools. These listings provided by the selected districts were used as sampling frames for selection of new public schools and updates of existing schools. This process was conducted through the NAEP State or TUDA Coordinator in each jurisdiction. The Coordinators were sent the information for all sampled districts in their respective jurisdictions and were responsible for returning the completed updates.
The following table presents the number and percentage of schools and average estimated grade enrollment for the fourth- and eighth-grade new-school frame by census region.
Number and percentage of schools and mean school size in the new-school frame, state assessment, by grade and census region: 2022
-
Census region
Grade 4
Grade 8
Schools
Percentage
Mean school size
Schools
Percentage
Mean school size
Total
259
100.00
57
343
100.00
57
Northeast
21
8.11
66
51
14.87
104
1Outlying areas are not classified by census region. They include schools in Puerto Rico and Department of Defense Education
Activity (DoDEA) schools not located in the 50 states or the District of Columbia. NOTE: Detail may not sum to totals because of rounding.
SOURCE: U.S. Department of Education, Institute of Education Sciences, National Center for Education Statistics, National Assessment of Educational Progress (NAEP), 2022 State Mathematics and Reading Assessments.
Census region
Grade 4 Grade 8

Schools Percentage Mean school size Schools Percentage Mean school size
-
Midwest
53
20.46
36
68
19.83
36
South
129
49.81
61
159
46.36
51
West
50
19.31
58
62
18.08
54
Outlying areas1
6
2.32
94
3
0.87
109
1Outlying areas are not classified by census region. They include schools in Puerto Rico and Department of Defense Education Activity (DoDEA) schools not located in the 50 states or the District of Columbia.
NOTE: Detail may not sum to totals because of rounding.
SOURCE: U.S. Department of Education, Institute of Education Sciences, National Center for Education Statistics, National Assessment of Educational Progress (NAEP), 2022 State Mathematics and Reading Assessments.
NAEP Technical Documentation School and Student Participation in the 2022 State Assessment
The tables linked to the right present weighted school and student participation rates and weighted student exclusion and full-time remote rates for the fourth- and eighth-grade public school state assessment samples.
A weighted school participation rate indicates the percentage of the student population that is directly represented by the participating school sample.
A weighted student participation rate indicates the percentage of the student population that is directly represented by the assessed students from within participating schools.
A weighted exclusion rate indicates the percentage of students in the population that would be excluded from the assessment. Students are generally excluded from a NAEP assessment if they have a disability or limited English language proficiency that prevents them from taking the assessment altogether or the accommodations they require to take the assessment were unavailable.
A weighted full-time remote rate indicates the percentage of the student population that is full-time remote.
Weighted school participation rates are calculated by dividing the sum of school base weights, weighted by student enrollment of the targeted grade, for all participating schools by the sum of the base weights, weighted by student enrollment of the target grade, for all eligible schools. Eligible schools are all sampled schools except those considered out-of-scope. The base weight is assigned to all sampled schools and is the inverse of the probability of selection. The weighted school participation rates in these tables reflect participation prior to
Weighted Response Rates of Fourth-Grade School Sample by Participating Jurisdiction
Weighted Response Rates of Eighth-Grade School Sample by Participating Jurisdiction
Weighted Student Response and Exclusion Rates for Mathematics
Weighted Student Response and Exclusion Rates for Reading
Weighted Student Remote Rates by Participating Jurisdiction
substitution. That is, participating substitute schools that took the place of refusing originally sampled schools are not included in the numerator.
Weighted student participation rates are calculated by dividing the sum of the student base weights for all assessed students by the sum of the student base weights for all assessable students. (See below for the response dispositions of NAEP sampled students.) Students deemed assessable are those who were assessed or absent. They do not include students that were not eligible (primarily made up of withdrawn or graduated students) or students with disabilities (SD) or English learners (EL) who were excluded from the assessment.
Weighted student exclusion rates are calculated by dividing the sum of the school nonresponse-adjusted student base weights for all excluded students by the sum for all assessable and excluded students.
Weighted student full-time remote rates are calculated by dividing the sum of the school nonresponse-adjusted student base weights for all full-time remote students by the sum for all assessable and excluded and full-time remote students.
Every student
sampled for
NAEP is
classified into
one of
the following
response disposition
categories:
![]() Assessed
Assessed
![]() Absent
Absent
![]() Excluded (must
be SD,
EL, or
SD and
EL)
Excluded (must
be SD,
EL, or
SD and
EL)
![]() Withdrawn or Graduated (ineligible)
Withdrawn or Graduated (ineligible)
![]() Full-time remote
Full-time remote
Assessed students were students that completed an assessment.
Absent students were students who were eligible to take an assessment but were absent from the initial session and the makeup session if one was offered. (Note, some schools, not all, had make-up sessions for students who were absent from the initial session.)
Excluded students were determined by their school to be unable to meaningfully take the NAEP assessment in their assigned subject, even with an accommodation. Excluded students must also be classified as SD and/or EL.
Withdrawn or graduated students are those who have left the school before the original assessment. These students are considered ineligible for NAEP. Full-time remote students are enrolled in brick-and-mortar schools but do not attend school in person. They are considered not assessable for NAEP.
NAEP Technical Documentation Weighted Response Rates of Eighth-Grade School Sample by Participating Jurisdiction for the 2022 State Assessment
The following table presents unweighted counts of eligible sampled and participating schools and weighted school response rates, by participating jurisdiction, for the eighth- grade public school state assessment sample. States with Trial Urban District Assessment (TUDA) districts are shown in multiple rows: for the TUDA district(s) and for the state as a whole (the TUDA district[s] plus the rest of the state).
A weighted school response rate indicates the percentage of the student population that is directly represented by the participating school sample. These response rates are based on the original sample of schools (excluding substitutes).
Eligible and participating school counts and weighted school response rates for eighth-grade mathematics and reading state assessments, by jurisdiction: 2022
Jurisdiction |
Number of sampled eligible schools |
Number of participating schools |
Weighted school response rates (percent) |
Total |
5,250 |
5,220 |
99.60 |
Alabama |
90 |
90 |
100.00 |
Alaska |
100 |
100 |
98.71 |
Arizona |
90 |
90 |
100.00 |
Arkansas |
90 |
90 |
100.00 |
California–Los Angeles |
60 |
60 |
100.00 |
California–San Diego |
30 |
30 |
100.00 |
California |
170 |
170 |
100.00 |
Colorado–Denver |
40 |
40 |
92.34 |
Colorado |
120 |
110 |
96.76 |
Connecticut |
80 |
80 |
98.77 |
Delaware |
50 |
50 |
100.00 |
Florida–Duval County |
40 |
40 |
100.00 |
Florida–Hillsborough County |
40 |
40 |
100.00 |
Florida–Miami-Dade County |
60 |
60 |
100.00 |
Florida |
200 |
200 |
100.00 |
Georgia–Atlanta |
30 |
30 |
100.00 |
Georgia |
110 |
110 |
100.00 |
Hawaii |
50 |
50 |
100.00 |
Idaho |
80 |
80 |
100.00 |
Illinois–Chicago |
70 |
70 |
100.00 |
Illinois |
140 |
140 |
100.00 |
Indiana |
80 |
80 |
98.83 |
Iowa |
80 |
80 |
100.00 |
Kansas |
90 |
90 |
100.00 |
Kentucky–Jefferson County |
20 |
20 |
100.00 |
Kentucky |
100 |
100 |
100.00 |
NOTE: Numbers of schools are rounded to nearest ten. Detail may not sum to totals due to rounding. |
|
||
SOURCE: U.S. Department of Education, Institute of Education Sciences, National Center for Education Statistics, National Assessment of Educational Progress (NAEP), 2022 State Mathematics and Reading Assessments.
Louisiana |
90 |
90 |
100.00 |
Maine |
90 |
90 |
97.56 |
Maryland–Baltimore |
40 |
40 |
100.00 |
Maryland |
120 |
120 |
100.00 |
Massachusetts–Boston |
40 |
40 |
100.00 |
Massachusetts |
120 |
120 |
100.00 |
Michigan–Detroit |
40 |
40 |
100.00 |
Michigan |
130 |
130 |
100.00 |
Minnesota |
80 |
80 |
98.62 |
Mississippi |
80 |
80 |
100.00 |
Missouri |
90 |
90 |
100.00 |
Montana |
100 |
100 |
99.95 |
Nebraska |
100 |
100 |
100.00 |
Nevada–Clark County |
50 |
50 |
100.00 |
Nevada |
90 |
90 |
100.00 |
New Hampshire |
80 |
80 |
98.97 |
New Jersey |
90 |
80 |
98.85 |
New Mexico–Albuquerque |
30 |
30 |
100.00 |
New Mexico |
100 |
100 |
100.00 |
New York–New York City |
70 |
60 |
96.75 |
New York |
120 |
120 |
97.65 |
North Carolina–Charlotte |
30 |
30 |
100.00 |
North Carolina–Guilford County |
20 |
20 |
100.00 |
North Carolina |
130 |
130 |
100.00 |
North Dakota |
80 |
80 |
100.00 |
Ohio–Cleveland |
50 |
50 |
100.00 |
Ohio |
130 |
130 |
100.00 |
Oklahoma |
90 |
90 |
100.00 |
Oregon |
90 |
90 |
100.00 |
Pennsylvania–Philadelphia |
40 |
40 |
91.14 |
Pennsylvania |
120 |
120 |
99.42 |
Rhode Island |
60 |
60 |
100.00 |
South Carolina |
90 |
90 |
100.00 |
South Dakota |
90 |
90 |
98.95 |
NOTE: Numbers of schools are rounded to nearest ten. Detail may not sum to totals due to rounding.
SOURCE: U.S. Department of Education, Institute of Education Sciences, National Center for Education Statistics, National Assessment of Educational Progress (NAEP), 2022 State Mathematics and Reading Assessments.
Tennessee–Shelby County |
40 |
40 |
100.00 |
Tennessee |
110 |
110 |
97.51 |
Texas–Austin |
20 |
20 |
100.00 |
Texas–Dallas |
40 |
40 |
100.00 |
Texas–Fort Worth |
20 |
20 |
100.00 |
Texas–Houston |
40 |
40 |
100.00 |
Texas |
200 |
200 |
100.00 |
Utah |
90 |
90 |
100.00 |
Vermont |
90 |
90 |
100.00 |
Virginia |
80 |
80 |
98.75 |
Washington |
90 |
90 |
100.00 |
West Virginia |
90 |
90 |
100.00 |
Wisconsin–Milwaukee |
40 |
40 |
100.00 |
Wisconsin |
130 |
130 |
100.00 |
Wyoming |
60 |
60 |
100.00 |
Other jurisdictions |
|||
Department of Defense Education Activity (DoDEA) |
50 |
40 |
94.14 |
District of Columbia (TUDA) |
20 |
20 |
100.00 |
District of Columbia |
70 |
70 |
100.00 |
Puerto Rico |
150 |
150 |
100.00 |
NOTE: Numbers of schools are rounded to nearest ten. Detail may not sum to totals due to rounding.
SOURCE: U.S. Department of Education, Institute of Education Sciences, National Center for Education Statistics, National Assessment of Educational Progress (NAEP), 2022 State Mathematics and Reading Assessments.
NAEP Technical Documentation Weighted Response Rates of Fourth-Grade School Sample by Participating Jurisdiction for the 2022 State Assessment
The following table presents unweighted counts of eligible sampled and participating schools and weighted school response rates, by participating jurisdiction, for the fourth- grade public school state assessment sample. States with Trial Urban District Assessment (TUDA) districts are shown in multiple rows: for the TUDA district(s) and for the state as a whole (the TUDA district[s] plus the rest of the state).
A weighted school response rate indicates the percentage of the student population that is directly represented by the participating school sample. These response rates are based on the original sample of schools (excluding substitutes).
Eligible and participating school counts and weighted school response rates for fourth-grade mathematics and reading state assessments, by jurisdiction: 2022
Jurisdiction |
Number of sampled eligible schools |
Number of participating schools |
Weighted school response rates (percent) |
Total |
5,830 |
5,800 |
99.51 |
Alabama |
90 |
90 |
100.00 |
Alaska |
130 |
120 |
99.20 |
Arizona |
90 |
90 |
100.00 |
Arkansas |
80 |
80 |
100.00 |
California–Los Angeles |
60 |
60 |
100.00 |
California–San Diego |
40 |
40 |
100.00 |
California |
180 |
180 |
100.00 |
Colorado–Denver |
40 |
40 |
100.00 |
Colorado |
120 |
120 |
99.04 |
Connecticut |
80 |
80 |
100.00 |
Delaware |
70 |
70 |
100.00 |
Florida–Duval County |
40 |
40 |
100.00 |
Florida–Hillsborough County |
40 |
40 |
100.00 |
Florida–Miami-Dade County |
60 |
60 |
100.00 |
Florida |
210 |
210 |
100.00 |
Georgia–Atlanta |
40 |
40 |
100.00 |
Georgia |
120 |
120 |
96.17 |
Hawaii |
90 |
90 |
100.00 |
Idaho |
90 |
90 |
100.00 |
Illinois–Chicago |
70 |
70 |
100.00 |
Illinois |
140 |
140 |
100.00 |
Indiana |
90 |
80 |
98.63 |
Iowa |
90 |
90 |
98.67 |
Kansas |
100 |
100 |
100.00 |
Kentucky–Jefferson County |
40 |
40 |
100.00 |
Kentucky |
110 |
110 |
100.00 |
Louisiana |
80 |
80 |
100.00 |
Maine |
110 |
110 |
100.00 |
Maryland–Baltimore |
40 |
40 |
100.00 |
NOTE: Numbers of schools are rounded to nearest ten. Detail may not sum to totals due to rounding. |
|
||
SOURCE: U.S. Department of Education, Institute of Education Sciences, National Center for Education Statistics, National Assessment of Educational Progress (NAEP), 2022 State Mathematics and Reading Assessments.
Maryland |
120 |
120 |
100.00 |
Massachusetts–Boston |
50 |
50 |
100.00 |
Massachusetts |
130 |
130 |
100.00 |
Michigan–Detroit |
40 |
40 |
100.00 |
Michigan |
130 |
130 |
100.00 |
Minnesota |
90 |
90 |
100.00 |
Mississippi |
90 |
90 |
100.00 |
Missouri |
90 |
90 |
100.00 |
Montana |
120 |
120 |
99.95 |
Nebraska |
100 |
100 |
100.00 |
Nevada–Clark County |
60 |
60 |
100.00 |
Nevada |
90 |
90 |
100.00 |
New Hampshire |
100 |
100 |
99.15 |
New Jersey |
90 |
80 |
98.72 |
New Mexico–Albuquerque |
40 |
40 |
100.00 |
New Mexico |
110 |
110 |
100.00 |
New York–New York City |
70 |
60 |
98.73 |
New York |
120 |
120 |
95.76 |
North Carolina–Charlotte |
40 |
40 |
100.00 |
North Carolina–Guilford County |
40 |
40 |
100.00 |
North Carolina |
160 |
160 |
100.00 |
North Dakota |
120 |
110 |
99.28 |
Ohio–Cleveland |
50 |
50 |
100.00 |
Ohio |
130 |
130 |
100.00 |
Oklahoma |
90 |
90 |
100.00 |
Oregon |
90 |
90 |
100.00 |
Pennsylvania–Philadelphia |
40 |
40 |
98.11 |
Pennsylvania |
120 |
120 |
99.86 |
Rhode Island |
90 |
90 |
100.00 |
South Carolina |
90 |
90 |
100.00 |
South Dakota |
120 |
120 |
100.00 |
Tennessee–Shelby County |
40 |
40 |
100.00 |
Tennessee |
120 |
120 |
100.00 |
Texas–Austin |
40 |
40 |
100.00 |
NOTE: Numbers of schools are rounded to nearest ten. Detail may not sum to totals due to rounding.
SOURCE: U.S. Department of Education, Institute of Education Sciences, National Center for Education Statistics, National Assessment of Educational Progress (NAEP), 2022 State Mathematics and Reading Assessments.
Texas–Dallas |
40 |
40 |
100.00 |
Texas–Fort Worth |
40 |
40 |
100.00 |
Texas–Houston |
60 |
60 |
100.00 |
Texas |
260 |
260 |
100.00 |
Utah |
80 |
80 |
100.00 |
Vermont |
130 |
130 |
100.00 |
Virginia |
80 |
80 |
100.00 |
Washington |
90 |
90 |
100.00 |
West Virginia |
100 |
100 |
100.00 |
Wisconsin–Milwaukee |
50 |
50 |
100.00 |
Wisconsin |
130 |
130 |
100.00 |
Wyoming |
100 |
90 |
98.78 |
Other jurisdictions |
|||
Department of Defense Education Activity (DoDEA) |
90 |
80 |
94.55 |
District of Columbia (TUDA) |
50 |
50 |
100.00 |
District of Columbia |
90 |
90 |
100.00 |
Puerto Rico |
150 |
150 |
100.00 |
NOTE: Numbers of schools are rounded to nearest ten. Detail may not sum to totals due to rounding.
SOURCE: U.S. Department of Education, Institute of Education Sciences, National Center for Education Statistics, National Assessment of Educational Progress (NAEP), 2022 State Mathematics and Reading Assessments.
NAEP Technical Documentation Weighted Student Remote Rates by Participating Jurisdiction for the 2022 State Assessment
In 2022 as a result of the COVID-19 pandemic, there was interest in determining the extent to which students were receiving their education through full-time remote learning. Full-time remote students are enrolled in brick-and-mortar schools but do not attend school in person. They are considered not assessable for NAEP.
The following table presents weighted student full-time remote rates by grade, subject, and participating jurisdiction, for the public school state assessment samples. States with Trial Urban District Assessment (TUDA) districts are shown in multiple rows: for the TUDA district(s) and for the state as a whole (the TUDA district[s] plus the rest of the state).
The weighted student full-time remote rate indicates the percentage of the student population that is full-time remote.
Weighted student full-time remote rates, state assessment, by grade, subject, and jurisdiction: 2022
-
Jurisdiction
Grade 4 mathematics
(percent)
Grade 4 reading
(percent)
Grade 8 mathematics
(percent)
Grade 8 reading
(percent)
National public
0.78
0.73
1.29
1.32
Alabama
0.39
0.41
0.79
0.70
Alaska
0.96
1.41
1.94
1.75
Arizona
0.42
0.37
1.25
0.80
Arkansas
1.27
1.52
2.33
2.26
California–Los Angeles
0.11
0.36
0.83
0.62
California–San Diego
0.32
0.10
0.00
0.00
California
0.71
0.30
1.12
0.86
Colorado–Denver
0.00
0.00
0.44
0.52
Colorado
0.34
0.32
0.22
0.46
Connecticut
0.00
0.06
0.05
0.06
Delaware
2.05
1.68
1.64
1.56
Florida–Duval County
0.00
0.00
0.08
0.00
Florida–Hillsborough County
0.00
0.00
0.00
0.00
Florida–Miami-Dade County
0.00
0.00
0.00
0.00
Florida
0.00
0.06
1.02
0.97
Georgia–Atlanta
2.09
2.05
4.46
3.49
Georgia
2.00
1.97
2.39
2.97
Hawaii
4.80
4.39
6.22
6.01
Idaho
0.32
0.24
0.97
0.74
Illinois–Chicago
0.00
0.00
0.00
0.13
Illinois
0.00
0.18
0.67
0.60
Indiana
0.79
0.94
1.99
2.69
Iowa
0.47
0.24
0.93
0.95
Kansas
0.14
0.10
0.53
0.33
Kentucky–Jefferson County
0.29
0.10
0.00
0.08
Kentucky
1.11
0.65
2.08
2.66
Louisiana
0.77
0.90
2.42
2.06
Maine
0.37
0.20
0.75
0.53
Maryland–Baltimore
1.19
1.11
0.70
0.82
Maryland
3.04
2.60
1.36
1.05
† Not applicable.
Jurisdiction
Grade 4 mathematics
(percent)
Grade 4 reading
(percent)
Grade 8 mathematics
(percent)
Grade 8 reading
(percent)
-
Massachusetts–Boston
0.46
0.13
0.00
0.00
Massachusetts
0.02
0.01
0.09
0.00
Michigan–Detroit
0.80
0.63
0.59
0.40
Michigan
1.76
1.89
2.19
2.96
Minnesota
0.91
0.78
0.15
0.15
Mississippi
0.37
0.51
0.46
0.44
Missouri
1.95
0.86
2.91
3.69
Montana
0.72
0.43
1.42
1.43
Nebraska
0.08
0.10
0.20
0.23
Nevada–Clark County
0.06
0.00
0.91
1.09
Nevada
0.19
0.21
0.60
0.95
New Hampshire
0.04
0.08
0.09
0.05
New Jersey
0.25
0.04
0.15
0.21
New Mexico–Albuquerque
0.45
0.38
0.00
0.00
New Mexico
1.71
1.60
2.24
2.65
New York–New York City
0.07
0.07
0.13
0.00
New York
0.09
0.02
0.20
0.13
North Carolina–Charlotte
0.00
0.11
0.00
0.00
North Carolina–Guilford County
0.00
0.00
0.00
0.00
North Carolina
0.58
1.05
1.92
1.45
North Dakota
0.04
0.05
0.29
0.42
Ohio–Cleveland
0.12
0.23
0.34
0.22
Ohio
0.22
0.06
0.87
0.96
Oklahoma
1.05
1.20
2.92
2.81
Oregon
1.51
1.89
3.22
3.67
Pennsylvania–Philadelphia
0.11
0.00
0.00
0.00
Pennsylvania
2.12
2.16
3.71
4.68
Rhode Island
0.05
0.00
0.12
0.17
South Carolina
1.92
3.14
3.48
2.41
South Dakota
0.30
0.05
0.64
0.59
Tennessee–Shelby County
0.00
0.00
0.00
0.00
Tennessee
0.00
0.05
0.04
0.26
Texas–Austin
0.11
0.00
0.00
0.00
† Not applicable.
Jurisdiction
Grade 4 mathematics
(percent)
Grade 4 reading
(percent)
Grade 8 mathematics
(percent)
Grade 8 reading
(percent)
-
Texas–Dallas
0.40
0.60
0.18
0.00
Texas–Fort Worth
0.09
0.00
0.00
0.00
Texas–Houston
0.32
0.16
0.00
0.00
Texas
0.57
0.56
0.20
0.29
Utah
1.41
1.38
1.42
1.35
Vermont
0.15
0.10
0.16
0.38
Virginia
1.54
1.46
4.03
3.93
Washington
0.23
0.31
1.08
0.85
West Virginia
2.26
1.45
2.77
2.56
Wisconsin–Milwaukee
0.58
0.12
0.70
0.99
Wisconsin
0.43
0.46
1.05
0.73
Wyoming
2.82
2.43
4.50
3.73
Other jurisdictions
Department of Defense Education Activity (DoDEA)
0.79
1.10
1.06
1.35
District of Columbia (TUDA)
0.48
0.44
0.89
0.44
District of Columbia
0.99
0.79
1.07
0.95
Puerto Rico
1.09
†
1.44
†
† Not applicable.
NOTE: Detail may not sum to totals because of rounding.
SOURCE: U.S. Department of Education, Institute of Education Sciences, National Center for Education Statistics, National Assessment of Educational Progress (NAEP), 2022 State Assessment.
NAEP Technical Documentation Weighted Student Response and Exclusion Rates for the 2022 State Mathematics Assessment
The following table presents weighted student response and exclusion rates, by participating jurisdiction, for the fourth- and eighth-grade public school state assessment samples. States with Trial Urban District Assessment (TUDA) districts are shown in multiple rows: for the TUDA district(s) and for the state as a whole (the TUDA district[s] plus the rest of the state).
Separate exclusion rates are provided for students with disabilities (SD) and English learners (EL).
A weighted student response rate indicates the percentage of the student population that is directly represented by the assessed students from within participating schools. A weighted exclusion rate indicates the percentage of students in the population that would be excluded from the assessment.
Weighted student response and exclusion rates for public schools, state mathematics assessment, by grade and jurisdiction: 2022
-
Grade 4
Grade 8
Jurisdiction
Weighted student response
rates (percent)
Weighted percentage of all students who were SD and
excluded
Weighted percentage of all students who were EL and excluded
Weighted student response
rates (percent)
Weighted percentage of all students who were SD and
excluded
Weighted percentage of all students who were EL and excluded
Total
91.78
1.47
0.71
88.69
1.20
0.60
Alabama
94.68
1.08
0.24
91.21
1.34
0.30
Alaska
88.61
0.83
0.41
83.79
0.99
0.46
Arizona
92.83
0.91
0.55
90.30
1.44
0.31
Arkansas
92.58
0.68
0.37
91.18
0.81
0.26
California–Los Angeles
91.97
1.40
1.21
88.71
1.53
1.00
California–San Diego
88.61
1.35
1.92
85.52
1.05
1.18
California
91.91
1.66
1.18
88.05
1.27
1.16
Colorado–Denver
88.86
0.64
1.80
87.68
2.14
1.15
Colorado
91.10
1.28
0.64
86.46
1.10
0.33
Connecticut
91.79
1.49
1.02
87.84
1.27
0.62
Delaware
91.03
1.18
0.77
87.27
1.44
0.51
Florida–Duval County
91.75
2.07
0.00
91.37
1.53
0.00
Florida–Hillsborough County
92.13
2.16
0.98
90.53
1.03
1.22
Florida–Miami-Dade County
94.64
1.27
2.00
91.25
1.96
1.62
Florida
91.80
1.89
0.94
89.47
1.96
0.59
Georgia–Atlanta
93.69
0.78
0.22
90.39
0.69
0.21
Georgia
92.84
1.12
0.37
90.25
1.48
0.41
Hawaii
88.53
1.24
0.74
85.29
1.47
0.81
Idaho
93.22
0.80
0.12
90.48
1.18
0.15
Illinois–Chicago
90.39
1.96
1.42
88.15
0.70
0.48
Illinois
91.19
1.06
0.51
87.95
0.84
0.47
Indiana
92.77
0.45
0.17
90.54
0.46
0.31
Iowa
93.08
1.21
0.40
90.13
1.15
0.38
Kansas
92.88
1.06
0.41
91.03
0.95
0.47
Kentucky–Jefferson County
93.68
2.46
1.33
91.05
1.29
0.26
Kentucky
94.50
1.56
0.44
89.43
1.95
0.38
SOURCE: U.S. Department of Education, Institute of Education Sciences, National Center for Education Statistics, National Assessment of Educational Progress (NAEP), 2022 State Mathematics Assessment.
Grade
4
Grade
8
Weighted
Weighted
Weighted
Weighted
Weighted
Weighted
student
percentage
of
percentage
of
student
percentage
of
percentage
of
response
all
students
who
all
students
who
response
all
students
who
all
students
who
rates
were
SD
and
were
EL
and
rates
were
SD
and
were
EL
and
(percent)
excluded
excluded
(percent)
excluded
excluded 
-
Louisiana
92.36
1.55
0.06
89.70
1.91
0.36
Maine
90.46
1.37
0.29
86.84
0.77
0.27
Maryland–Baltimore
89.82
0.84
0.55
90.04
2.06
0.90
Maryland
92.09
0.73
0.74
89.06
1.14
0.93
Massachusetts–Boston
90.83
3.52
3.86
88.86
4.22
3.96
Massachusetts
92.84
1.31
0.77
87.89
1.04
1.81
Michigan–Detroit
89.97
3.96
0.15
88.79
4.47
0.74
Michigan
91.18
2.59
0.48
86.82
1.58
0.29
Minnesota
90.79
2.11
0.77
85.74
1.55
0.65
Mississippi
92.78
0.71
0.10
90.09
0.72
0.22
Missouri
94.35
0.78
0.14
91.73
0.65
0.33
Montana
89.77
0.95
0.05
85.81
1.17
0.10
Nebraska
94.76
1.19
0.04
92.46
1.40
0.36
Nevada–Clark County
92.17
0.97
0.69
85.93
0.99
0.85
Nevada
92.26
1.58
0.56
87.92
0.92
0.65
New Hampshire
86.89
1.03
0.25
82.00
1.29
0.19
New Jersey
92.15
1.23
0.93
91.20
0.77
0.83
New Mexico–Albuquerque
91.29
0.46
0.17
85.50
1.37
1.01
New Mexico
90.58
1.40
0.48
88.36
1.43
0.52
New York–New York City
87.37
0.25
1.01
83.59
0.45
0.49
New York
86.46
0.69
0.59
81.09
1.22
0.51
North Carolina–Charlotte
92.44
1.13
1.68
89.89
1.63
1.81
North Carolina–Guilford County
92.62
1.35
0.11
89.25
1.58
0.44
North Carolina
90.96
1.19
1.08
90.32
0.79
0.46
North Dakota
90.24
1.11
0.23
88.51
1.25
0.17
Ohio–Cleveland
88.77
2.44
0.41
87.12
2.85
1.20
Ohio
92.78
0.94
0.33
89.59
0.78
0.39
Oklahoma
93.65
2.17
0.36
92.11
1.30
0.44
Oregon
87.89
1.11
0.67
84.92
0.98
0.76
Pennsylvania–Philadelphia
93.65
3.18
1.47
86.81
2.86
2.16
Pennsylvania
92.53
1.54
0.51
89.04
1.04
0.35
SOURCE: U.S. Department of Education, Institute of Education Sciences, National Center for Education Statistics, National Assessment of Educational Progress (NAEP), 2022 State Mathematics Assessment.
Grade
4
Grade
8
Weighted
Weighted
Weighted
Weighted
Weighted
Weighted
student
percentage
of
percentage
of
student
percentage
of
percentage
of
response
all
students
who
all
students
who
response
all
students
who
all
students
who
rates
were
SD
and
were
EL
and
rates
were
SD
and
were
EL
and
(percent)
excluded
excluded
(percent)
excluded
excluded
-
Rhode Island
94.25
1.01
0.73
90.48
1.39
1.09
South Carolina
93.01
0.75
0.36
91.36
1.03
0.54
South Dakota
93.78
1.04
0.24
91.16
1.41
0.21
Tennessee–Shelby County
94.05
2.33
1.41
90.34
2.53
0.23
Tennessee
92.04
1.89
0.64
90.98
1.77
0.64
Texas–Austin
87.96
2.18
1.94
84.80
1.45
1.31
Texas–Dallas
91.71
3.08
2.06
91.02
1.68
1.20
Texas–Fort Worth
93.11
1.89
0.59
91.81
2.03
0.74
Texas–Houston
93.43
2.52
1.15
88.66
1.45
1.72
Texas
92.75
2.35
1.18
89.72
1.11
0.67
Utah
92.24
0.90
0.29
87.70
1.27
0.54
Vermont
88.80
1.32
0.09
87.05
1.50
0.22
Virginia
91.98
2.25
1.05
88.42
1.18
0.87
Washington
89.21
1.74
0.88
86.92
1.17
0.34
West Virginia
92.64
1.59
0.05
90.99
1.32
0.26
Wisconsin–Milwaukee
86.42
1.00
0.56
80.38
1.91
0.67
Wisconsin
90.27
1.15
0.45
87.83
1.06
0.24
Wyoming
90.11
1.17
0.10
87.33
1.24
0.25
Other jurisdictions
Department of Defense Education Activity (DoDEA)
88.71
1.43
0.29
89.55
0.89
0.23
District of Columbia (TUDA)
89.57
1.93
1.64
81.92
2.27
1.77
District of Columbia
88.24
1.37
1.05
82.67
1.80
1.04
Puerto Rico
92.19
0.10
0.06
91.07
0.02
0.04
SOURCE: U.S. Department of Education, Institute of Education Sciences, National Center for Education Statistics, National Assessment of Educational Progress (NAEP), 2022 State Mathematics Assessment.
NAEP Technical Documentation Weighted Student Response and Exclusion Rates for the 2022 State Reading Assessment
The following table presents weighted student response and exclusion rates, by participating jurisdiction, for the fourth- and eighth-grade public school state assessment samples. States with Trial Urban District Assessment (TUDA) districts are shown in multiple rows: for the TUDA district(s) and for the state as a whole (the TUDA district[s] plus the rest of the state).
Separate exclusion rates are provided for students with disabilities (SD) and English learners (EL).
A weighted student response rate indicates the percentage of the student population that is directly represented by the assessed students from within participating schools. A weighted exclusion rate indicates the percentage of students in the population that would be excluded from the assessment.
Weighted student response and exclusion rates for public schools, state reading assessment, by grade and jurisdiction: 2022
-
Grade 4
Grade 8
Jurisdiction
Weighted student response
rates (percent)
Weighted percentage of all students who were SD and
excluded
Weighted percentage of all students who were EL and excluded
Weighted student response
rates (percent)
Weighted percentage of all students who were SD and
excluded
Weighted percentage of all students who were EL and excluded
Total
91.60
1.55
0.78
88.82
1.41
0.71
Alabama
93.53
0.76
0.47
92.41
0.74
0.24
Alaska
88.73
0.57
0.09
82.03
0.38
0.17
Arizona
92.25
0.90
0.41
89.78
1.56
0.26
Arkansas
93.87
1.35
0.38
91.43
1.19
0.55
California–Los Angeles
92.38
1.20
1.59
89.78
1.47
1.33
California–San Diego
88.59
1.77
1.88
88.48
1.83
0.51
California
91.45
1.93
1.09
88.09
1.70
1.59
Colorado–Denver
90.68
1.52
2.43
88.48
1.77
1.52
Colorado
91.37
1.94
1.17
86.94
1.29
0.96
Connecticut
88.93
1.23
1.45
88.43
1.32
0.63
Delaware
89.69
1.05
0.39
87.58
1.05
0.52
Florida–Duval County
93.11
2.08
0.00
92.24
1.77
0.08
Florida–Hillsborough County
93.93
1.52
1.50
88.96
1.66
1.62
Florida–Miami-Dade County
92.83
1.26
1.88
90.11
1.67
1.79
Florida
93.05
1.08
1.32
87.36
1.76
0.66
Georgia–Atlanta
92.78
2.56
0.62
90.57
2.62
0.32
Georgia
92.18
1.26
0.70
92.79
1.66
0.37
SOURCE: U.S. Department of Education, Institute of Education Sciences, National Center for Education Statistics, National Assessment of Educational Progress (NAEP), 2022 State Reading Assessment.
Grade
4
Grade
8
Weighted
Weighted
Weighted
Weighted
Weighted
Weighted
student
percentage
of
percentage
of
student
percentage
of
percentage
of
response
all
students
who
all
students
who
response
all
students
who
all
students
who
rates
were
SD
and
were
EL
and
rates
were
SD
and
were
EL
and
(percent)
excluded
excluded
(percent)
excluded
excluded
-
Hawaii
88.58
1.07
0.27
83.42
1.26
0.40
Idaho
92.45
1.58
0.26
91.03
1.41
0.62
Illinois–Chicago
89.02
1.90
1.18
88.67
1.26
0.87
Illinois
90.91
0.73
0.50
88.38
0.97
0.50
Indiana
93.09
0.35
0.32
90.34
0.28
0.28
Iowa
92.99
0.91
0.31
90.16
0.78
0.44
Kansas
93.24
0.92
0.10
92.93
1.11
0.26
Kentucky–Jefferson County
92.34
3.53
3.25
91.78
1.78
0.36
Kentucky
93.45
2.47
0.81
91.10
1.76
0.50
Louisiana
92.12
2.01
0.43
89.24
2.33
0.53
Maine
92.02
0.81
0.33
89.52
1.07
0.31
Maryland–Baltimore
90.67
1.61
1.61
90.61
2.05
0.88
Maryland
91.81
1.07
1.00
90.36
0.98
1.08
Massachusetts–Boston
90.96
4.17
3.54
87.12
2.92
4.15
Massachusetts
92.98
1.80
1.04
88.83
1.15
1.79
Michigan–Detroit
89.44
4.02
0.41
87.61
4.78
0.70
Michigan
90.98
2.24
0.54
86.24
1.30
0.25
Minnesota
91.18
3.11
1.02
84.69
1.26
0.82
Mississippi
92.70
1.31
0.00
91.75
0.58
0.10
Missouri
93.38
0.66
0.18
92.49
0.90
0.30
Montana
89.73
1.32
0.00
87.24
0.79
0.05
Nebraska
94.33
1.02
0.27
92.69
1.13
0.34
Nevada–Clark County
91.94
1.08
0.91
86.43
1.12
0.48
Nevada
91.47
1.08
0.67
88.06
1.06
0.39
New Hampshire
87.70
1.06
0.13
84.57
0.71
0.33
New Jersey
91.90
2.13
0.77
89.50
1.60
0.71
New Mexico–Albuquerque
91.29
1.05
0.67
86.92
1.02
0.20
New Mexico
91.03
1.19
0.35
87.17
1.56
0.32
New York–New York City
87.42
0.92
1.59
84.41
0.51
0.60
New York
86.57
1.52
0.86
81.82
1.60
0.72
North Carolina–Charlotte
91.77
0.93
0.87
89.31
1.02
2.05
Grade
4
Grade
8
Weighted
Weighted
Weighted
Weighted
Weighted
Weighted
student
percentage
of
percentage
of
student
percentage
of
percentage
of
response
all
students
who
all
students
who
response
all
students
who
all
students
who
rates
were
SD
and
were
EL
and
rates
were
SD
and
were
EL
and
(percent)
excluded
excluded
(percent)
excluded
excluded
-
North Carolina–Guilford County
91.77
1.61
0.21
89.39
0.92
0.18
North Carolina
91.11
1.33
0.58
89.15
1.47
0.54
North Dakota
91.16
1.52
0.23
88.82
1.37
0.22
Ohio–Cleveland
87.53
1.84
0.40
89.60
2.72
1.44
Ohio
92.35
2.03
0.43
89.39
1.02
0.47
Oklahoma
92.40
1.50
0.35
92.72
2.02
0.72
Oregon
89.66
1.70
0.47
85.28
0.80
0.38
Pennsylvania–Philadelphia
93.38
4.10
3.05
88.26
3.26
2.24
Pennsylvania
91.83
1.67
0.59
89.13
1.34
0.51
Rhode Island
93.82
0.69
0.50
89.57
1.31
0.60
South Carolina
92.09
1.24
0.43
92.35
0.75
0.61
South Dakota
93.95
0.88
0.16
91.64
1.30
0.49
Tennessee–Shelby County
91.22
3.25
0.57
89.30
2.29
0.45
Tennessee
91.68
1.63
0.61
89.14
2.29
0.57
Texas–Austin
89.14
2.76
3.88
86.68
1.55
1.10
Texas–Dallas
92.41
2.05
3.03
93.27
1.84
1.98
Texas–Fort Worth
91.01
2.77
1.38
91.91
1.32
0.30
Texas–Houston
92.05
1.86
0.71
89.49
1.78
2.26
Texas
92.44
2.10
1.34
90.81
1.74
0.70
Utah
92.30
0.54
0.59
87.55
0.71
0.65
Vermont
89.00
1.18
0.32
86.98
1.51
0.20
Virginia
91.86
1.81
0.78
89.02
1.66
1.57
Washington
88.85
1.53
0.62
85.49
1.35
0.43
West Virginia
90.27
1.63
0.03
90.88
1.58
0.15
Wisconsin–Milwaukee
85.33
1.41
0.91
83.36
0.69
0.52
Wisconsin
90.73
0.76
0.29
88.02
0.57
0.30
Wyoming
91.74
1.56
0.43
87.19
1.20
0.48
Other jurisdictions
Department of Defense Education Activity (DoDEA)
89.71
1.18
0.74
89.68
1.15
0.63
District of Columbia (TUDA)
88.64
3.89
2.41
83.17
2.74
2.31
District of Columbia
87.75
3.07
1.53
83.75
2.12
1.38
NAEP Technical Documentation School Sample Selection for the 2022 State Assessment
The sampled schools for the fourth- and eighth-grade public school state assessments in mathematics and reading came from two frames: the primary public school sample frame constructed from the Common Core of Data (CCD) and the supplemental new-school sampling frame. Schools were sampled from each school frame with probability proportional to size (PPS) using systematic sampling. Prior to sampling, schools in each frame were sorted by the appropriate implicit stratification variables in a serpentine order. A school's measure of size was a complex function of the school's estimated grade enrollment. Schools whose measure of size was larger than the sampling interval could be selected or “hit” multiple times. Schools with multiple hits were selected with certainty and had larger student sample sizes.
For the CCD-based frame, schools were sampled at a rate that would yield specific target student sample sizes for each jurisdiction. All
Computation of Measures of Size
School Sample Sizes: Frame and New School
Evaluation of the Samples Using State Achievement Data
jurisdictions, except Puerto Rico, had a target student sample size of 4,100 students for grade 4, and 4,200 for grade 8. The goal was to obtain 3,500 assessed students per grade: 1,750 students for the reading operational assessments, and 1,750 students for the mathematics operational assessments. Puerto Rico had a target student sample size of 3,600 students per grade. By design, Bureau of Indian Education (BIE) schools were not part of the state assessments this year. However, separate BIE school samples were selected based on target student sample sizes that were large enough to ensure that BIE schools were sufficiently represented in the national samples.
The schools in the new-school frame were sampled at the same rate as the CCD-based school frame.
Prior to selection, schools were deeply stratified in each jurisdiction to ensure that the school sample distribution reflected the school population distribution as closely as possible, with regard to the stratification variables, to minimize sampling error. The success of this approach was shown by comparing the proportion of minorities enrolled in schools (based on CCD values for each school), median income, and urban-centric locale (viewed as an interval variable) reported in the original frame against the school sample.
In addition, the distribution of state assessment achievement scores for the original frame can be compared with that of the school sample for those jurisdictions for which state assessment achievement data are available, as was done in the evaluation of the samples using state achievement data.
NAEP Technical Documentation Computation of Measures of Size for the 2022 State Assessment
In designing each school sample, six objectives underlie the process of determining the probability of selection for each school and how many students are to be sampled from each selected school containing the respective grade:
![]() to meet
the target
student sample
size for
each grade;
to meet
the target
student sample
size for
each grade;
![]() to select an equal-probability sample of students;
to select an equal-probability sample of students;
![]() to limit the number of students selected from any one school;
to limit the number of students selected from any one school;
![]() to ensure
that the
sample within
a school
does not
include a
very high
percentage of
the students
in the
school, unless
all students
are included;
to ensure
that the
sample within
a school
does not
include a
very high
percentage of
the students
in the
school, unless
all students
are included;
![]() to reduce
the sampling
rate of
small schools,
in recognition
of the
greater cost
and burden
per student
of conducting
assessments in
such schools;
and
to reduce
the sampling
rate of
small schools,
in recognition
of the
greater cost
and burden
per student
of conducting
assessments in
such schools;
and
![]() to ensure
the inclusion
of all
eligible schools
that were
part of
the NAEP
2021 Monthly
School Survey
and NAEP
2021 School
and Teacher
Questionnaire Study.
to ensure
the inclusion
of all
eligible schools
that were
part of
the NAEP
2021 Monthly
School Survey
and NAEP
2021 School
and Teacher
Questionnaire Study.
The goal in determining the school's measure of size (MOS) is to optimize across the middle four objectives in terms of maintaining the precision of estimates and the cost effectiveness of the sample design. In certain jurisdictions, a census of students was taken so as to meet, as nearly as possible, the target student sample size. Elsewhere, to meet the target student sample and achieve a reasonable compromise among the middle four objectives above, the following algorithm was used to assign a measure of size to each school based on its enrollment per grade as indicated on the sampling frame.
The preliminary measures of size were set as follows:
\begin{equation} MOS_{js} =
\left\{ \begin{array}{l}
x_{js} & \text{if } z_{js} < x_{js} \\[2pt]
y_{j} & \text{if } 20 < x_{js} \leq{z_{js}} \\[2pt]
\left(\dfrac{y_j}{20}\right) \times x_{js} & \text{if } 10 < x_{js} \leq {20} \\
\dfrac{y_j}{2} & x_{js} \leq {10} \end{array}\right.
\end{equation}
where `x_{js}` is the estimated grade enrollment for school `s` in jurisdiction `j`, `y_{j}` the target within-school student sample size for jurisdiction `j`, and `z_{js}` the within-school take-all student cutoff for jurisdiction `j` to which school `s` belongs.
For the state samples at grades 4 and 8, the target sample sizes and take-all cutoffs were 50 and 52 for all jurisdictions and TUDAs with the exception of Puerto Rico, where they were 25 and 26, respectively.
The preliminary measure of size reflects the need to lower the expected number of very small schools in the sample, as the marginal cost for each assessed student in these schools is higher. These very small schools are sampled at half the rate of the larger schools, and their weights are doubled to account for the half sampling.
To address the last bullet above, an adjustment was made to the preliminary measures of size in an attempt to ensure the inclusion of all eligible schools that were part of
the NAEP 2021 Monthly School Survey and NAEP 2021 School and Teacher Questionnaire Study sample. The NAEP sampling procedures used an adaptation of the Keyfitz process to compute conditional measures of size that, by design, maximized the overlap of schools selected for both years.
The preliminary school measure of size is rescaled to create an expected number of hits by applying a multiplicative constant \(b_{j}\), which varies by jurisdiction \(j\). One can choose a value of \(b_{j}\) such that the expected overall student sample yield matches the desired target specified by the design, where the expected yield is calculated by
summing the product of an individual school's probability and its student yield across all schools in the frame. The final measure of size, `E_{js}`, is defined as:
\begin{equation}
E_{js}=min(b_{j}\times MOS_{js}, u_{j}),
\end{equation}
The quantity `u_{j}` (the maximum number of hits allowed) in this formula is designed to put an upper bound on the burden for the sampled schools. In most jurisdictions,
`u_{j}` was set to 3. At grades 4 and 8 in Alaska and grade 8 in DC, `u_{j}` was set to 8, and in Puerto Rico, `u_{j}` was set to 1.
In addition, new and newly-eligible schools were sampled from the new-school frame. The assigned measures of size for these schools,
\begin{equation}
E_{js}=min(b_{j}\times MOS_{js}\times \pi_{djs}^{-1} , u_{j}),
\end{equation}
used the `b_{j}` and `u_{j}` values from the CCD-based school frame for the jurisdiction (i.e., the same sampling rate as for the CCD-based school sample within each jurisdiction). The variable `pi_{djs}` is the probability of selection of the district into the new-school district (`d`) sample.
NAEP Technical Documentation Evaluation of the Samples for the 2022 State Assessment Using State Achievement Data
The purpose of this analysis was to determine whether public schools selected for the 2022 samples were representative of the schools on the NAEP sampling frames in terms of student achievement. Percentiles of the achievement distributions were compared between the frame and school sample for each public school jurisdiction in grades 4 and 8.
Achievement Data
For grades 4 and 8, the achievement variable used in the analysis was the same variable used in the NAEP sample design to stratify the public school frame. For all jurisdictions in the analysis except Puerto Rico, the variable was an achievement score provided by the jurisdiction. However, for Puerto Rico, where achievement data were not available, the 2015–2019 American Community Survey (ACS) 5-year estimates for median household income were used. (Median household income was based on the five-digit zip code area in which the school was located.) The achievement data consisted of various types of school-specific achievement measures from state assessment programs. The type of achievement data available varied by jurisdiction. For instance, in some states, the measure was the average score for a given state assessment. In other states, the measure was a percentile rank or percentage of students above a specific score. For Connecticut at grade 4, for example, we used the percentage of students in grade 4 who scored at or above the proficient level on the state mathematics test.
During frame development, not every record on the Common Core of Data (CCD) file matched the achievement data files created for the National Center for Education Statistics (NCES), even in jurisdictions where those data were generally available. For schools that did not match, their achievement scores were imputed by a mean matching imputation approach using the mean achievement score for schools with complete achievement data within the same jurisdiction-urbanicity-race/ethnicity stratum combination.
Methodology
To determine whether the distributions of schools by achievement measure between the frame and school sample were different, comparisons of percentile estimates were made for the 10th, 25th, 50th, 75th, and 90th percentile levels as well as the mean for each public school jurisdiction by grade. Frame and school sample estimates were considered statistically different if the frame value fell outside the 95 percent confidence interval of the corresponding sample estimate. The percentile values for the frames were calculated by weighting each school by the estimated number of students in the given grade. The percentile estimates for the school samples were calculated using school weights and weighted by the school measure of size (estimated number of students in the given grade). The 95 percent confidence intervals for the school sample estimates were calculated in WesVar—software for computing estimates of sampling variance from complex sample survey (Westat, 2000b)—using the Woodruff method (Sarndal, Swensson, and Wretman 1992) with the use of a finite population correction factor.
Results
As mentioned above, sample and frame distributions of schools by achievement measure were determined to be different if at least one of the percentile estimates or the mean differed significantly at the 95 percent confidence level. Out of all the jurisdiction and grade comparisons (excluding jurisdictions where all schools in the frame were selected), only 64 of the 876 distributions compared were found to be significantly different. They are shown in the table below.
Summary of significant differences in achievement measures (median income) between the sample and the frame, state assessment, by grade and jurisdiction: 2022
-
Grade
Jurisdiction
Achievement data / median income
Estimate
Frame
Sample
Confidence interval
4
Illinois
Achievement data
10th percentile
9.80
6.74
(5.97, 9.52)
Louisiana
Achievement data
10th percentile
40.33
37.98
(30.09, 40.31)
New Jersey
Achievement data
10th percentile
23.56
22.01
(18.78, 22.85)
New Mexico
Achievement data
50th percentile
25.97
27.63
(26.30, 28.60)
New York
Achievement data
10th percentile
19.64
21.56
(20.19, 22.50)
North Dakota
Achievement data
25th percentile
32.29
30.43
(27.13, 32.06)
Puerto Rico
Median Income
75th percentile
23473.03
23214.50
(23079.13, 23349.87)
Tennessee
Achievement data
10th percentile
21.25
24.05
(22.15, 26.31)
Washington
Achievement data
50th percentile
55.14
57.97
(55.39, 58.66)
Washington
Achievement data
90th percentile
79.44
75.83
(74.84, 78.31)
Albuquerque
Achievement data
25th percentile
12.50
11.66
(10.63, 12.21)
Austin
Achievement data
90th percentile
69.64
69.40
(69.36, 69.44)
Baltimore
Achievement data
90th percentile
43.00
40.13
(36.97, 42.16)
Charlotte-Mecklenburg
Achievement data
25th percentile
31.71
31.05
(30.91, 31.14)
Chicago
Achievement data
25th percentile
10.71
12.54
(10.87, 13.81)
Dallas
Achievement data
50th percentile
42.99
46.39
(46.37, 46.41)
Dallas
Achievement data
75th percentile
53.85
55.64
(55.11, 56.17)
Dallas
Achievement data
mean
45.25
46.12
(45.27, 46.96)
Duval County (FL)
Achievement data
10th percentile
38.5
29.68
(24.23, 36.77)
SOURCE: U.S. Department of Education, Institute of Education Sciences, National Center for Education Statistics, National Assessment of Educational Progress (NAEP), 2022 State
Mathematics and Reading Assessments.
Grade Jurisdiction
Achievement data /
median income Estimate Frame Sample Confidence interval
-
Houston
Achievement data
50th percentile
38.75
37.22
(36.25, 38.71)
Houston
Achievement data
mean
43.13
41.89
(41.29, 42.49)
Jefferson County (KY)
Achievement data
10th percentile
9.66
9.85
(9.73, 9.93)
New York City
Achievement data
50th percentile
48.96
47.00
(46.57, 48.46)
Shelby County (TN)
Achievement data
50th percentile
32.02
31.17
(31.02, 31.31)
8
Arizona
Achievement data
10th percentile
13.84
12.58
(9.51, 13.07)
Arizona
Achievement data
75th percentile
51.25
47.93
(45.35, 50.16)
Arkansas
Achievement data
50th percentile
50.01
50.80
(50.09, 52.31)
Hawaii
Achievement data
90th percentile
64.95
63.82
(63.34, 64.30)
Idaho
Achievement data
90th percentile
62.55
57.26
(55.91, 61.82)
Idaho
Achievement data
mean
41.25
39.78
(38.81, 40.74)
Massachusetts
Achievement data
50th percentile
45.95
47.39
(46.74, 48.98)
Michigan
Achievement data
50th percentile
42.82
39.47
(38.15, 42.71)
Mississippi
Achievement data
25th percentile
28.60
25.27
(23.28, 28.58)
Mississippi
Achievement data
50th percentile
47.07
46.45
(43.15, 47.04)
Montana
Achievement data
90th percentile
53.50
52.39
(51.98, 52.82)
Montana
Achievement data
mean
36.58
35.74
(34.95, 36.52)
Nebraska
Achievement data
50th percentile
48.94
47.87
(47.18, 48.63)
Nevada
Achievement data
10th percentile
12.22
12.42
(12.23, 13.35)
New Mexico
Achievement data
90th percentile
37.07
31.48
(30.41, 36.68)
Ohio
Achievement data
25th percentile
53.32
49.12
(44.01, 53.04)
Oregon
Achievement data
25th percentile
28.55
26.78
(25.39, 27.74)
Pennsylvania
Achievement data
90th percentile
54.15
52.63
(49.94, 53.62)
Pennsylvania
Achievement data
mean
32.54
31.27
(30.27, 32.26)
South Dakota
Achievement data
90th percentile
64.30
63.81
(63.29, 64.14)
Utah
Achievement data
10th percentile
21.64
20.63
(18.77, 21.57)
West Virginia
Achievement data
50th percentile
37.06
36.08
(34.18, 36.92)
West Virginia
Achievement data
mean
36.77
36.05
(35.47, 36.64)
Baltimore
Achievement data
50th percentile
7.21
6.23
(5.00, 6.56)
Charlotte-Mecklenburg
Achievement data
75th percentile
58.86
60.10
(59.85, 60.35)
Charlotte-Mecklenburg
Achievement data
90th percentile
75.56
75.48
(75.43, 75.53)
Chicago
Achievement data
75th percentile
36.31
33.54
(32.32, 36.16)
Duval County (FL)
Achievement data
75th percentile
71.28
68.33
(67.75, 69.04)
Houston
Achievement data
50th percentile
57.90
55.74
(52.46, 57.8)
Houston
Achievement data
75th percentile
67.56
65.81
(63.98, 67.05)
SOURCE: U.S. Department of Education, Institute of Education Sciences, National Center for Education Statistics, National Assessment of Educational Progress (NAEP), 2022 State Mathematics and Reading Assessments.
Grade Jurisdiction
Achievement data /
median income Estimate Frame Sample Confidence interval
-
Houston
Achievement data
mean
55.23
53.56
(52.06, 55.06)
Los Angeles
Achievement data
mean
2514.30
2520.07
(2515.28, 2524.85)
Milwaukee
Achievement data
75th percentile
24.73
23.61
(22.99, 24.22)
Milwaukee
Achievement data
mean
15.84
16.65
(15.88, 17.41)
New York City
Achievement data
25th percentile
22.99
18.88
(16.60, 22.5)
New York City
Achievement data
50th percentile
38.26
34.83
(33.82, 36.37)
New York City
Achievement data
mean
41.79
39.55
(38.01, 41.08)
Philadelphia City
Achievement data
50th percentile
10.40
9.03
(8.62, 10.36)
Philadelphia City
Achievement data
75th percentile
21.71
21.19
(21.08, 21.30)
Shelby County (TN)
Achievement data
90th percentile
48.93
49.67
(49.43, 50.35)
SOURCE: U.S. Department of Education, Institute of Education Sciences, National Center for Education Statistics, National Assessment of Educational Progress (NAEP), 2022 State Mathematics and Reading Assessments.
The number of significant differences found in this analysis was close to what would be expected, albeit slightly higher, given the large number of comparisons that were made. Also, the number of significant results were widely spread throughout different grades and jurisdictions. Even in the statistically significant cases, the close adherence of sample values to frame values suggests there is little evidence that the school sample for NAEP 2022 is not representative of the frame from which it was selected. The achievement/median-income variable is used as the third-level sort order variable in the school systematic selection procedure. While it may be a rather low level sort variable, it still helps control how representative the sampled schools are in terms of achievement. The close agreement between frame and sample values of these achievement/median- income variables provided assurance that the selected sample is representative of the frame with respect to achievement or income status.
NAEP Technical Documentation School Sample Sizes: CCD-Based and New- School Sampling Frames for the 2022 State Assessment
The following table presents the number of schools selected for the fourth- and eighth-grade public school mathematics and reading samples by sampling frame ( Common Core of Data [CCD]-based and new school) and participating jurisdiction. The school counts shown are at the time of sampling. In the table, the first column, Jurisdiction, is either the "state name" if the state does not have a Trial Urban District Assessments (TUDA) district (e.g., Alaska) or the "state name + TUDA district name" (e.g., California— Los Angeles) and "state name + non-TUDA part" (e.g., California—Balance).
After school sampling, some schools in TUDA districts were discovered to be charter schools that were the responsibility of the state and not the individual TUDA district. These schools were reclassified from TUDA to "balance of the state".
Number of schools in the total, CCD-based, and new-school samples, state assessment, by grade and region: 2022
Jurisdiction |
Grade 4 |
Grade 8 |
||||
Total school sample |
CCD-based school sample |
New-school sample |
Total school sample |
CCD-based school sample |
New-school sample |
|
Total |
6,010 |
5,960 |
50 |
5,490 |
5,440 |
60 |
Alabama |
90 |
90 |
# |
90 |
90 |
# |
Alaska |
130 |
130 |
# |
110 |
110 |
# |
Arizona |
90 |
90 |
# |
90 |
90 |
# |
Arkansas |
90 |
90 |
# |
90 |
90 |
# |
California–Los Angeles |
60 |
60 |
# |
60 |
60 |
# |
California–San Diego |
40 |
40 |
# |
40 |
40 |
# |
California–Balance |
80 |
80 |
# |
80 |
80 |
# |
Colorado–Denver |
40 |
40 |
# |
40 |
40 |
# |
Colorado–Balance |
80 |
80 |
# |
80 |
80 |
# |
Connecticut |
90 |
90 |
# |
90 |
90 |
# |
Delaware |
80 |
80 |
# |
50 |
50 |
# |
Florida–Duval County |
40 |
40 |
# |
40 |
30 |
# |
Florida–Hillsborough County |
40 |
40 |
# |
40 |
40 |
# |
Florida–Miami-Dade County |
60 |
60 |
# |
70 |
70 |
# |
Florida–Balance |
60 |
60 |
# |
70 |
70 |
# |
Georgia–Atlanta |
40 |
40 |
# |
30 |
30 |
# |
Georgia–Balance |
80 |
80 |
# |
80 |
80 |
# |
Hawaii |
90 |
90 |
# |
50 |
50 |
# |
Idaho |
90 |
90 |
# |
90 |
90 |
# |
Illinois–Chicago |
70 |
70 |
# |
70 |
70 |
# |
Illinois–Balance |
80 |
80 |
# |
70 |
70 |
# |
Indiana |
90 |
90 |
# |
90 |
90 |
# |
Iowa |
90 |
90 |
# |
90 |
90 |
# |
Kansas |
100 |
100 |
# |
90 |
90 |
# |
Kentucky–Jefferson County |
40 |
40 |
# |
30 |
30 |
# |
Kentucky–Balance |
70 |
70 |
# |
80 |
80 |
# |
Louisiana |
90 |
90 |
# |
90 |
90 |
# |
Maine |
110 |
110 |
# |
90 |
90 |
# |
Maryland–Baltimore |
50 |
50 |
# |
50 |
50 |
# |
# Rounds to zero. |
||||||
Grade
4
Grade
8
Total
school
CCD-based
school
New-school
Total
school
CCD-based
school
New-school
sample
sample
sample
sample
sample
sample 
Maryland–Balance |
80 |
80 |
# |
80 |
80 |
# |
Massachusetts–Boston |
50 |
50 |
# |
50 |
50 |
# |
Massachusetts–Balance |
80 |
80 |
# |
80 |
80 |
# |
Michigan–Detroit |
40 |
40 |
# |
40 |
40 |
# |
Michigan–Balance |
90 |
90 |
# |
90 |
90 |
# |
Minnesota |
90 |
90 |
# |
100 |
90 |
# |
Mississippi |
90 |
90 |
# |
90 |
90 |
# |
Missouri |
100 |
100 |
# |
100 |
100 |
# |
Montana |
130 |
130 |
# |
100 |
100 |
# |
Nebraska |
100 |
100 |
# |
100 |
100 |
# |
Nevada–Clark County |
60 |
60 |
# |
50 |
50 |
# |
Nevada–Balance |
30 |
30 |
# |
30 |
30 |
# |
New Hampshire |
100 |
100 |
# |
80 |
80 |
# |
New Jersey |
90 |
90 |
# |
90 |
90 |
# |
New Mexico–Albuquerque |
40 |
40 |
# |
40 |
30 |
# |
New Mexico–Balance |
70 |
70 |
# |
70 |
70 |
# |
New York–New York City |
70 |
70 |
# |
70 |
70 |
# |
New York–Balance |
60 |
60 |
# |
60 |
60 |
# |
North Carolina–Charlotte |
40 |
40 |
# |
30 |
30 |
# |
North Carolina–Guilford County |
40 |
40 |
# |
30 |
30 |
# |
North Carolina–Balance |
80 |
70 |
# |
80 |
80 |
# |
North Dakota |
120 |
120 |
# |
90 |
90 |
# |
Ohio–Cleveland |
50 |
50 |
# |
50 |
50 |
# |
Ohio–Balance |
90 |
90 |
# |
90 |
90 |
# |
Oklahoma |
100 |
100 |
# |
90 |
90 |
# |
Oregon |
90 |
90 |
# |
90 |
90 |
# |
Pennsylvania–Philadelphia |
40 |
40 |
# |
40 |
40 |
# |
Pennsylvania–Balance |
80 |
80 |
# |
80 |
80 |
# |
Rhode Island |
90 |
90 |
# |
60 |
60 |
# |
South Carolina |
90 |
90 |
# |
90 |
90 |
# |
South Dakota |
120 |
120 |
# |
100 |
100 |
# |
Tennessee–Shelby County |
40 |
40 |
# |
40 |
40 |
# |
# Rounds to zero.
Grade
4
Grade
8
Total
school
CCD-based
school
New-school
Total
school
CCD-based
school
New-school
sample
sample
sample
sample
sample
sample
Tennessee–Balance |
80 |
80 |
# |
80 |
80 |
# |
Texas–Austin |
40 |
40 |
# |
20 |
20 |
# |
Texas–Dallas |
40 |
40 |
# |
40 |
40 |
# |
Texas–Fort Worth |
40 |
40 |
# |
30 |
30 |
# |
Texas–Houston |
60 |
60 |
# |
40 |
40 |
# |
Texas–Balance |
80 |
80 |
# |
80 |
80 |
# |
Utah |
90 |
90 |
# |
90 |
90 |
# |
Vermont |
130 |
130 |
# |
90 |
90 |
# |
Virginia |
90 |
80 |
# |
90 |
80 |
# |
Washington |
90 |
90 |
# |
90 |
90 |
# |
West Virginia |
100 |
100 |
# |
90 |
90 |
# |
Wisconsin–Milwaukee |
50 |
50 |
# |
40 |
40 |
# |
Wisconsin–Balance |
90 |
90 |
# |
80 |
80 |
# |
Wyoming |
100 |
100 |
# |
70 |
60 |
10 |
Other jurisdictions |
|
|
|
|
|
|
Bureau of Indian Education (BIE) |
10 |
10 |
# |
10 |
10 |
# |
Department of Defense Education Activity (DoDEA) |
100 |
90 |
10 |
60 |
60 |
# |
District of Columbia (TUDA) |
50 |
50 |
# |
30 |
30 |
# |
District of Columbia–Balance |
40 |
40 |
# |
50 |
40 |
10 |
Puerto Rico |
150 |
150 |
# |
150 |
150 |
# |
# Rounds to zero.
NOTE: Numbers of schools are rounded to nearest ten. Detail may not sum to totals due to rounding.
SOURCE: U.S. Department of Education, Institute of Education Sciences, National Center for Education Statistics, National Assessment of Educational Progress (NAEP), 2022 State Mathematics and Reading Assessments.
NAEP Technical Documentation Stratification of Schools for the 2022 State Assessment
The purpose of school stratification is to increase the efficiency and ensure the representativeness of the school samples in terms of important school-level characteristics, such as geography (e.g., states and TUDA districts), urbanicity, and race/ethnicity classification. NAEP school sampling utilizes two types of stratification: explicit and implicit.
Stratification Variables
Explicit stratification partitions the sampling frame into mutually exclusive groupings called strata. The systematic samples selected from these strata are independent, meaning that each is selected with its own unique random start. The explicit school strata for the 2022 NAEP state assessments were usually states. If a state contained Trial Urban District Assessment (TUDA) districts, the explicit strata were each individual TUDA district and the balance of the state. In 2022, there were 26 participating TUDA districts in the NAEP state assessment program. They are listed below:
![]() Albuquerque Public
Schools, New
Mexico;
Albuquerque Public
Schools, New
Mexico;
![]() Atlanta Public Schools, Georgia;
Atlanta Public Schools, Georgia;
![]() Austin Independent
School District,
Texas;
Austin Independent
School District,
Texas;
![]() Baltimore City Public Schools, Maryland;
Baltimore City Public Schools, Maryland;
![]() Boston Public Schools, Massachusetts;
Boston Public Schools, Massachusetts;
![]() Charlotte-Mecklenburg
Schools, North
Carolina;
Charlotte-Mecklenburg
Schools, North
Carolina;
![]() Chicago Public Schools, Illinois;
Chicago Public Schools, Illinois;
![]() Clark County School District, Nevada;
Clark County School District, Nevada;
![]() Cleveland Metropolitan
School District,
Ohio;
Cleveland Metropolitan
School District,
Ohio;
![]() Dallas Independent School District, Texas;
Dallas Independent School District, Texas;
![]() Denver Public
Schools, Colorado;
Denver Public
Schools, Colorado;
![]() Detroit Public
Schools, Michigan;
Detroit Public
Schools, Michigan;
![]() District of
Columbia Public
Schools, District
of Columbia;
District of
Columbia Public
Schools, District
of Columbia;
![]() Duval County Public Schools, Florida;
Duval County Public Schools, Florida;
![]() Fort Worth
Independent School
District, Texas;
Fort Worth
Independent School
District, Texas;
![]() Guilford County Schools, North Carolina;
Guilford County Schools, North Carolina;
![]() Hillsborough County
Public Schools,
Florida;
Hillsborough County
Public Schools,
Florida;
![]() Houston Independent School District,
Texas;
Houston Independent School District,
Texas;
![]() Jefferson County
Public Schools
(Louisville), Kentucky;
Jefferson County
Public Schools
(Louisville), Kentucky;
![]() Milwaukee Public Schools, Wisconsin;
Milwaukee Public Schools, Wisconsin;
![]() Los Angeles
Unified School
District, California;
Los Angeles
Unified School
District, California;
![]() Miami-Dade County Public Schools, Florida;
Miami-Dade County Public Schools, Florida;
![]() New York
City Department
of Education,
New York;
New York
City Department
of Education,
New York;
![]() School District of Philadelphia, Pennsylvania;
School District of Philadelphia, Pennsylvania;
![]() San Diego
Unified School
District, California;
and
San Diego
Unified School
District, California;
and
![]() Shelby County Schools, Tennessee.
Shelby County Schools, Tennessee.
Implicit stratification involves sorting the sampling frame, as opposed to grouping the frame. For NAEP, schools are sorted by key school characteristics within explicit strata and sampled systematically using this ordering. This type of stratification ensures the representativeness of the school samples with respect to the key school characteristics. The implicit school stratification variables for the 2022 state assessments included urbanicity, race/ethnicity classification, achievement score/median income, and magnet school indicator. Further details about these variables can be found here.
NAEP Technical Documentation Stratification Variables for the 2022 State Assessment
The implicit stratification of public schools for the NAEP 2022 state assessments involved four dimensions:
![]() urbanicity
classification
(urban-centric locale);
urbanicity
classification
(urban-centric locale);
![]() race/ethnicity classification;
race/ethnicity classification;
![]() achievement data
or median
income; and
achievement data
or median
income; and
![]() magnet school indicator.
magnet school indicator.
The urbanicity stratum is the top-level implicit stratification variable and is assigned within each explicit stratum. It is derived from the NCES urban-centric locale variable and classifies schools based on location (city, suburb, town, rural) and proximity to urbanized areas. It has 12 possible values.
The race/ethnicity stratum classifies schools by the relative magnitude of enrollment of non-Hispanic White, non-Hispanic Black,
Stratification by Urbanicity Classification
Stratification by Race/ethnicity Classification
Stratification by Achievement Data and Median Income
Missing Stratification Variables
Hispanic, Asian, American Indian/Alaska Native, Hawaiian/Pacific Islander, and students classified as two or more races represented in schools. The source of the race/ethnicity data is the Common Core of Data (CCD). The race/ethnicity stratum is the second-level variable in the stratification hierarchy and is nested within the urbanicity stratum.
The next stratification dimension is a classification of schools based on either achievement data or median household income. For most jurisdictions including TUDA districts, it is based on achievement data. However, not all jurisdictions provide achievement data. In these cases, median household income is used instead. Median income comes from 5-year estimates from the 2015–2019 American Community Survey (ACS), and it corresponds to the zip code area where the school is located.
The final stratification dimension indicates whether a school is classified as a magnet school or not, according to the CCD. It is used to provide an additional level of classification among the highest-achieving schools, to differentiate between high-achieving magnet schools and high-achieving non-magnet schools. Many domains do not classify any schools as magnet, in which case this variable has no effect on the implicit stratification.
Missing values for stratification variables were imputed.
The implicit stratification in this hierarchical procedure was achieved via a "serpentine sort" within a given explicit stratum. This sort was accomplished by alternating between ascending and descending sort order on each variable successively through the sort hierarchy. The following table shows an oversimplified example to illustrate the ascending- descending-ascending-descending pattern of the serpentine sort. Since the magnet school indicator was not applicable in most domains, it is omitted from the example table for simplicity.
Stratification variables sorted by serpentine sort: 2022
-
TUDA
Urbanicity
Race/ethnicity level
Achievement score
Yes
Large City
High minority
20
22
27
30
SOURCE: U.S. Department of Education, Institute of Education Sciences, National Center for Education Statistics, National Assessment of Educational Progress (NAEP), 2022 State Mathematics and Reading Assessments.
TUDA Urbanicity Race/ethnicity level Achievement score
-
Low minority
29
26
20
18
Mid-size City
Low minority
15
25
27
31
High minority
35
32
30
28
No
Mid-size City
High minority
20
22
27
30
Low minority
29
26
20
18
Large City
Low minority
15
25
27
31
High minority
35
32
30
28
SOURCE: U.S. Department of Education, Institute of Education Sciences, National Center for Education Statistics, National Assessment of Educational Progress (NAEP), 2022 State Mathematics and Reading Assessments.
NAEP Technical Documentation Missing Stratification Variables for the 2022 State Assessment
Schools with missing stratification variables had their data imputed as follows.
Schools missing the urbanicity (urban-centric locale) variable were assigned the modal value of urbanicity for schools in the same five-digit zip code or the same city. The modal value is the value that occurs the most. For example, one school in zip code 32305 has missing urbanicity. In the same five-digit zip code area, there are 20 schools with non-missing urbanicity variable. Fifteen of them have an urbanicity value of "mid-size city", and the other five have an urbanicity value of "large suburb". The modal value
of urbanicity for schools in zip code 32305 is "mid-size city".
The mean ethnicity percentage was imputed at the five-digit zip code level only if all schools were missing ethnicity at the district level, and only at the three-digit zip code prefix if the five-digit zip code ethnicity mean was missing as well. Thus, schools with missing or questionable values in race/ethnicity enrollment data—those in which the summation of the ethnicity percentages did not fall in the range 97 through 103, indicating a gross error—were assigned the average race/ethnicity enrollment within (in priority order) their school district, five-digit zip code, or three-digit zip code prefix.
Schools with missing achievement data in jurisdictions and grades for which achievement data were used in stratification were assigned the mean achievement data value within their urbanization and race/ethnicity classification. The achievement data were imputed only for those schools in jurisdictions and grades in which achievement data were used for stratification.
Schools missing median household income were assigned the mean value of median household income for the five-digit zip code prefix in which they were located. If it was not available or it was unreliable, then the mean value of median household income for the three-digit zip code prefix was used. In some cases, imputation was not possible at the three-digit zip code level, and needed to be done at the city and state level.
Schools with missing estimated grade enrollment had their estimated grade enrollment set to 20.
NAEP Technical Documentation Stratification by Achievement Data and Median Income for the 2022 State Assessment
The achievement data obtained from each jurisdiction, including TUDA districts, are derived from the results of state assessment programs. The contents of the achievement data files varied by jurisdiction and included achievement measures for a variety of subjects, grades, and multiple assessment programs. One achievement measure was selected for each responding jurisdiction to be used in the stratification process. Where available, the achievement data were used for implicit stratification by grade. Since the achievement data are more current than the median household income data, as well as more likely to be well-correlated to NAEP assessment scores, they were judged to be a more effective stratification variable. The achievement measures were selected according to the following criteria:
![]() At both
grades 4
and 8,
achievement measures
from state
assessments conducted
in mathematics
and reading
were under
consideration. If
both were
available, the
mathematics measure was preferred.
As a rule, the most current measures available were used. For
all jurisdictions, the measures were from the 2018–2019 state
At both
grades 4
and 8,
achievement measures
from state
assessments conducted
in mathematics
and reading
were under
consideration. If
both were
available, the
mathematics measure was preferred.
As a rule, the most current measures available were used. For
all jurisdictions, the measures were from the 2018–2019 state
assessments.
![]() Achievement measures should match to at least 70 percent of
the schools on the sampling frames.
Achievement measures should match to at least 70 percent of
the schools on the sampling frames.
![]() Achievement measures
should differentiate
schools from
one another.
For example,
district-level measures
or those
with high
missing rates
(30 percent
or more),
were judged not
to be
useful for
differentiating schools.
In addition,
achievement measures
that did
not have
large enough
dispersion, based
on inspection,
were not
used for
stratification either.
Achievement measures
should differentiate
schools from
one another.
For example,
district-level measures
or those
with high
missing rates
(30 percent
or more),
were judged not
to be
useful for
differentiating schools.
In addition,
achievement measures
that did
not have
large enough
dispersion, based
on inspection,
were not
used for
stratification either.
![]() All other things being equal, the possibilities for score
types were average scale score, median scale score, percentile rank,
median percentile rank, normal curve equivalent,
raw score,
index score,
and percentage
above a
particular cut
point or
quartile. In
general, the
availability varied
for any
given
jurisdiction/grade/subject/year.
All other things being equal, the possibilities for score
types were average scale score, median scale score, percentile rank,
median percentile rank, normal curve equivalent,
raw score,
index score,
and percentage
above a
particular cut
point or
quartile. In
general, the
availability varied
for any
given
jurisdiction/grade/subject/year.
Achievement data used for implicit stratification were obtained for all 50 states and the District of Columbia for both fourth- and eighth-grade assessments. In Alaska where the match rate was too low, 2016–2017 state assessment data were used instead. In Puerto Rico where achievement data were not available, median household income was used based on the zip code area in which the school was located. The source of median household income for Puerto Rico was 5-year estimates from the 2015–2019 American Community Survey (ACS). The estimated grade enrollment was used for the stratification for DoDEA and BIE schools, since neither achievement data nor median income were available. Estimated grade enrollment was obtained from the Common Core of Data (CCD) file developed by NCES.
NAEP Technical Documentation Stratification by Race/Ethnicity Classification for the 2022 State Assessment
Race/ethnicity classification was based on the second and third largest race/ethnicity percentages (among non-Hispanic White, non-Hispanic Black, Hispanic, Asian, American Indian/Alaska Native, Native Hawaiian/Pacific Islander, and students classified as two or more races) within each urbanicity classification stratum. The race/ethnicity strata were formed using one of three classification schemes as follows:
![]() Case 1:
Urbanicity cells
where both
the second
and third
largest race/ethnicity
groups contained
less than
7 percent
of students
in the
urbanicity cell
were not
stratified by
race/ethnicity enrollment (race/ethnicity stratification value was
set to 0). There were no
race/ethnicity strata formed within these urbanicity cells.
Case 1:
Urbanicity cells
where both
the second
and third
largest race/ethnicity
groups contained
less than
7 percent
of students
in the
urbanicity cell
were not
stratified by
race/ethnicity enrollment (race/ethnicity stratification value was
set to 0). There were no
race/ethnicity strata formed within these urbanicity cells.
![]() Case 2: Urbanicity cells where the second largest
race/ethnicity group contained at least 7 percent but the second and
third largest race/ethnicity groups combined contained
no more
than 15
percent of
students in
the urbanicity
cell were
stratified into
three race/ethnicity
cells. Schools
were ordered
by the
sum of
the percentage
of race/ethnicity enrollment for the second and third largest
groups within the urbanicity cell and then divided into three
approximately equal size groups in terms of students.
Case 2: Urbanicity cells where the second largest
race/ethnicity group contained at least 7 percent but the second and
third largest race/ethnicity groups combined contained
no more
than 15
percent of
students in
the urbanicity
cell were
stratified into
three race/ethnicity
cells. Schools
were ordered
by the
sum of
the percentage
of race/ethnicity enrollment for the second and third largest
groups within the urbanicity cell and then divided into three
approximately equal size groups in terms of students.
![]() Case 3:
Urbanicity cells
where both
the second
and third
largest race/ethnicity
groups contained
more than
15 percent
of students
in the
urbanicity cell
were stratified
into four race/ethnicity cells.
The second largest group provided the primary stratification
variable; the third largest group provided the secondary
stratification variable.
Case 3:
Urbanicity cells
where both
the second
and third
largest race/ethnicity
groups contained
more than
15 percent
of students
in the
urbanicity cell
were stratified
into four race/ethnicity cells.
The second largest group provided the primary stratification
variable; the third largest group provided the secondary
stratification variable.
Within an urbanicity cell, schools were first sorted based on the primary stratification variable. Then they were divided into two strata of schools containing approximately equal numbers of students. Within each of these two strata, the schools were sorted by the secondary stratification variable and subdivided into two substrata of schools containing approximately equal numbers of students. The four race/ethnicity classifications consisted of the following values: low primary
variable/low secondary variable, low primary variable/high secondary variable, high primary variable/low secondary variable, and high primary variable/high secondary variable.
NAEP Technical Documentation Stratification by Urbanicity Classification for the 2022 State Assessment
The creation of the urbanicity classification variable was based on the NCES urban-centric locale and was defined within each explicit stratum. The NCES urban-centric locale contains the following categories:
![]() Large City:
Territory inside
an urbanized
area and
inside a
principal city
with a
population of
250,000 or
more;
Large City:
Territory inside
an urbanized
area and
inside a
principal city
with a
population of
250,000 or
more;
![]() Mid-size City:
Territory inside
an urbanized
area and
inside a
principal city
with a
population less
than 250,000
and greater
than or
equal to
100,000;
Mid-size City:
Territory inside
an urbanized
area and
inside a
principal city
with a
population less
than 250,000
and greater
than or
equal to
100,000;
![]() Small City: Territory
inside an urbanized area and inside a principal city with a
population less than 100,000;
Small City: Territory
inside an urbanized area and inside a principal city with a
population less than 100,000;
![]() Large Suburb:
Territory outside
a principal
city and
inside an
urbanized area
with a
population of
250,000 or
more;
Large Suburb:
Territory outside
a principal
city and
inside an
urbanized area
with a
population of
250,000 or
more;
![]() Mid-size Suburb:
Territory outside
a principal
city and
inside an
urbanized area
with a
population less
than 250,000
and greater
than or
equal to
100,000;
Mid-size Suburb:
Territory outside
a principal
city and
inside an
urbanized area
with a
population less
than 250,000
and greater
than or
equal to
100,000;
![]() Small Suburb: Territory
outside a principal city and inside an urbanized area with a
population less than 100,000;
Small Suburb: Territory
outside a principal city and inside an urbanized area with a
population less than 100,000;
![]() Fringe Town:
Territory inside
an urban
cluster that
is less
than or
equal to
10 miles
from an
urbanized area;
Fringe Town:
Territory inside
an urban
cluster that
is less
than or
equal to
10 miles
from an
urbanized area;
![]() Distant Town:
Territory inside
an urban
cluster that
is more
than 10
miles and
less than
or equal
to 35
miles from
an urbanized
area;
Distant Town:
Territory inside
an urban
cluster that
is more
than 10
miles and
less than
or equal
to 35
miles from
an urbanized
area;
![]() Remote Town:
Territory inside an urban cluster that is more than 35 miles
from an urbanized area;
Remote Town:
Territory inside an urban cluster that is more than 35 miles
from an urbanized area;
![]() Fringe Rural:
Census-defined rural
territory that
is less
than or
equal to
5 miles
from an
urbanized area,
as well
as rural
territory that
is less
than or
equal to
2.5 miles from an
urban cluster;
Fringe Rural:
Census-defined rural
territory that
is less
than or
equal to
5 miles
from an
urbanized area,
as well
as rural
territory that
is less
than or
equal to
2.5 miles from an
urban cluster;
![]() Distant Rural:
Census-defined rural
territory that
is more
than 5
miles but
less than
or equal
to 25
miles from
an urbanized
area, as
well as
rural territory
that is
more than
Distant Rural:
Census-defined rural
territory that
is more
than 5
miles but
less than
or equal
to 25
miles from
an urbanized
area, as
well as
rural territory
that is
more than
2.5 miles but less than or equal to 10 miles from an urban cluster; and
![]() Remote Rural:
Census-defined rural
territory that
is more
than 25
miles from
an urbanized
area and
is also
more than
10 miles
from an
urban cluster.
Remote Rural:
Census-defined rural
territory that
is more
than 25
miles from
an urbanized
area and
is also
more than
10 miles
from an
urban cluster.
In addition to the 12 categories above, the category "outside of the United States: Department of Defense Education Activity (DoDEA) overseas schools or Puerto Rico" is used. For the definitions of the geographic terms used in these descriptions, please refer to the Census Bureau’s website (for example, www.census.gov/programs- surveys/metro-micro.html).
The urbanicity classification cells were created by starting with the original NCES urban-centric locale categories. Urbanicity strata were collapsed with neighboring strata until a minimum cell size criterion, in terms of the percentage of students, was met. The minimum cell size criterion varied by type of explicit stratum. The criterion for explicit strata comprising the largest TUDA districts (Los Angeles, New York City, Chicago, Miami-Dade, Houston, and Clark County) was 13 percent; for the other TUDA districts, it was 20 percent; and for all other explicit strata, it was 10 percent.
The urbanicity classification variable was equal to the original NCES urban-centric locale if no collapsing was necessary. If collapsing was necessary, the collapsing scheme first collapsed within the four major strata (city, suburbs, town, rural). For example, urbanicity categories 1, 2, and 3 within city were collapsed (1 with 2, 2 with 3) if cells 1 or 3 were deficient. If the middle cell (e.g., 2) was deficient, then it was collapsed with the smaller of the two end cells. If a collapsed pair was still deficient, it was collapsed with the remaining unit within the major stratum. That is, a single city cell would be created by collapsing the large city, mid-size city, and small city cells. If a cell was still deficient after collapsing within major stratum, further collapsing across major strata occurred as needed until the deficiency was resolved. The values of the urbanicity classification variable were set equal to the cell value of the final level of collapsing.
Prior experience with this type of stratification has shown that the greatest efficiency of stratification results when cities and suburb areas are always kept separate from towns and rural areas, even if the enrollment criterion is violated.
NAEP Technical Documentation Student Sample Selection for the 2022 State Assessment
The sampling of students for the state assessments in mathematics and reading involved two steps: (1) sampling of students in the targeted grade (fourth or eighth) from each sampled school, and (2) assignment of assessment subject (mathematics or reading) to the sampled students.
Sampling Students within Sampled Schools
Within each sampled school, a sample of students was selected from a list of students in the targeted grade such that every student had an equal chance of selection. The student lists were submitted either electronically using a system known as E-filing or on paper. In E-filing, student lists are submitted as Excel files by either school coordinators, NAEP State Coordinators, or NAEP TUDA Coordinators. The files can be submitted for one school at a time (known as single school E-file submission) or for an entire jurisdiction at once (known as multiple school E-file submission). E-filing allows schools to easily submit student demographic data electronically with the student lists, easing the burden on field supervisors and school coordinators.
Schools that are unable to submit their student lists using the E-filing system provide hardcopy lists to field supervisors. In 2022, across all state assessment samples combined, over 99 percent of the participating schools E-filed their student lists while less than 1 percent of the participating schools submitted hardcopy lists.
In year-round multi-track schools, students in tracks scheduled to be on break on the assessment day were removed from the student lists prior to sampling. (Student base weights were adjusted to account for these students.)
The sampling process was the same, regardless of list submission type. The sampling process was systematic (e.g., if the sampling rate was one-half, a random starting point of one or two was chosen, and every other student on the list was selected). For E-filed schools only, where demographic data was submitted for every student on the frame, students were sorted by gender and race/ethnicity before the sample was selected to implicitly stratify the sample.
In some jurisdictions, every student in the targeted grade was needed to meet the overall student sample size. In these jurisdictions, all students in all schools at the targeted grade were sampled.
In the other jurisdictions except for Puerto Rico, in schools with up to 52 students in the targeted grade, all students were selected. In schools with more than 52 students, systematic samples of 50 students were selected. In some cases, a larger school may have been selected with certainty during the school sample selection process, and thus may have selected more students.
For Puerto Rico, in schools with up to 26 students in the targeted grade, all students were selected. In schools with more than 26 students, systematic samples of 25 students were selected.
Some students enrolled in the school after the sample was selected. In such cases, new enrollees were sampled at the same rate as the students on the original list.
Assigning Assessment Subject to Sampled Students
In all jurisdictions except Puerto Rico, sampled students including new enrollees in each participating sampled school were assigned to either the mathematics or the reading assessment at rates of 52 percent and 48 percent, respectively, for grade 4; or 50 percent for each subject for grade 8, using a process known as spiraling. In this process, test forms were randomly assigned to sampled students from test form sets that had, on average, a ratio of 26 mathematics forms to 24 reading forms for grade 4, and a ratio of 25 mathematics forms to 25 reading forms for grade 8. Students receiving a mathematics form were in the mathematics assessment, and students receiving a reading form were in the reading assessment. For Puerto Rico, all students were assigned a mathematics form since it was only participating in the operational mathematics assessment.
NAEP Technical Documentation Target Population for the 2022 State Assessment
The target population for the 2022 fourth- and eighth-grade public school state assessments in mathematics and reading was defined as all fourth- and eighth-grade students who were enrolled in public schools located in the 50 states, the District of Columbia, and Puerto Rico, Bureau of Indian Education (BIE) schools, and Department of Defense Education Activity (DoDEA) schools (including those located outside the United States).
NAEP Technical Documentation Weighting Procedures for the 2022 Assessment
NAEP assessments use complex sample designs to create student samples that generate population and subpopulation estimates with reasonably high precision. School and student sampling weights ensure valid inferences from the student samples to their respective populations. In 2022, weights were developed for schools and students sampled at grades 4 and 8 for assessments in
Computation of Full-Sample Student Weights
mathematics and reading, schools and students sampled at grade 8 for assessments in civics and U.S. history, and for schools and students sampled at ages 9 and 13 for long-term trend (LTT) assessments in mathematics and reading. The grade-based assessments were administered using tablets, and the LTT assessments were administered using paper and pencil.
Student Weights
Each student was assigned a weight to be used for making inferences about students in the target population. This weight is known as the final full-sample student weight and contains the following major components:
![]() the student base weight,
the student base weight,
![]() school nonresponse adjustments,
school nonresponse adjustments,
![]() student nonresponse
adjustments,
student nonresponse
adjustments,
![]() school weight trimming adjustments,
school weight trimming adjustments,
![]() student weight
trimming adjustments,
and
student weight
trimming adjustments,
and
![]() student raking adjustment.
student raking adjustment.
Computation of Replicate Student Weights for Variance Estimation
Computation of Full-Sample School Weights
Computation of Replicate School Weights for Variance Estimation
Quality Control on Weighting Procedures
The student base weight is the inverse of the overall probability of selecting a student and assigning that student to a particular assessment. The sample design that determines the base weights is discussed in the NAEP 2022 Sample Design section.
The student base weight is adjusted for two sources of nonparticipation: at the school level and at the student level. These weighting adjustments seek to reduce the potential for bias from such nonparticipation. Responding schools receive a weighting adjustment to compensate for nonresponding schools, and responding students receive a weighting adjustment to compensate for nonresponding students.
Furthermore, the final weights reflect the trimming of extremely large weights at both the school and student level. These weighting adjustments seek to reduce variances of survey estimates.
An additional weighting adjustment was implemented in the state and Trial Urban District Assessment (TUDA) samples so that estimates for key student-level characteristics were in agreement across assessments in reading and mathematics. This adjustment was implemented using a raking procedure. A similar but separate adjustment was also implemented for the national public school civics and U.S. history samples at grade 8. The raking procedure implemented for civics and U.S. history brought estimates for key student-level characteristics into agreement with those from mathematics and reading at the national level. Similar to previous years, raking was not performed for any of the private school student samples or for student samples in the LTT assessments.
In addition to the final full-sample weight, a set of replicate weights was provided for each student. These replicate weights are used to calculate the variances of survey estimates using the jackknife repeated replication method. The methods used to derive these weights were aimed at reflecting the features of the sample design, so that when the jackknife variance estimation procedure is implemented, approximately unbiased estimates of sampling variance are obtained. In addition, the various weighting procedures were repeated on each set of replicate weights to appropriately reflect the impact of the weighting adjustments on the sampling variance of a survey estimate. A finite population correction (fpc) factor was incorporated into the replication scheme so that it could be reflected in the variance estimates for the grade-based assessments. Similar to previous years, the replication scheme for LTT does not incorporate a finite population correction factor. See Computation of Replicate Student Weights for Variance Estimation for details.
School Weights
In addition to student weights, school weights were calculated to provide secondary users means to analyze data at the school level. The school weights are subject specific and represent the schools that contained at least one student that participated in the NAEP assessment for that subject.
Each school was assigned a weight to be used for making inferences about schools in the target population. This weight is known as the final full-sample school weight, and it contains five major components:
![]() the school base weight,
the school base weight,
![]() school nonresponse adjustment,
school nonresponse adjustment,
![]() school weight trimming adjustment,
school weight trimming adjustment,
![]() school session
assignment weight,
and
school session
assignment weight,
and
![]() small-school subject adjustment.
small-school subject adjustment.
The school base weight is the inverse of the probability of selecting a school for a particular assessment. The school nonresponse adjustment increase the weights of participating schools to account for similar schools that did not participate, and the school trimming adjustment reduce extremely large weights to decrease variances of survey estimates. These two adjustments are the same school-level adjustments used in the student full-sample weight described above.
The school session assignment weight reflects the probability that the particular session type was assigned to the school.
The small-school subject adjustment accounts for very small schools that did not have enough participating students for every subject associated to the school. School weights for subjects that had at least one eligible student are inflated by this factor to compensate for subject(s) that did not have any eligible students in that school and, thus, are not represented otherwise. In addition to the full-sample weight, a set of replicate weights was provided for each school. The school replicate weights are used to calculate the variances of school-level survey estimates using the jackknife repeated replication method.
Quality Control Procedures
Quality control checks were carried out throughout the weighting process to ensure the accuracy of the full-sample and replicate weights. See Quality Control on Weighting Procedures for the various checks implemented and main findings of interest.
NAEP Technical Documentation Computation of Full-Sample School Weights
The full-sample or final school weight is the sampling weight used to derive NAEP school estimates of population and subpopulation characteristics for a specified grade (4 and 8) or age (9) and assessment subject (civics, mathematics, reading, and U.S. history). The full-sample school weight reflects the number of schools that the sampled school represents in the population for purposes of estimation.
The full-sample weight, which is used to produce survey estimates, is distinct from a replicate weight that is used to estimate variances of survey estimates. The full-sample weight is assigned to participating schools and reflects the school base weight after the application of the various weighting adjustments. The full-sample weight \ (SCH\_WGT_{js}\) for school \(s\) in stratum \(j\) can be expressed as follows:
\begin{equation} SCH\_WGT_{js} = SCH\_BWT_{js} \times SCH\_NRAF_{js} \times SCH\_TRIM_{js} \times SCHSESWT_{js} \times SCH\_SUBJ\_AF_{js}
\end{equation} where
 \(SCH\_BWT_{js}\)
is the
school base
weight;
\(SCH\_BWT_{js}\)
is the
school base
weight;
\(SCH\_NRAF_{js}\)
is the
school-level nonresponse
adjustment factor;
 \(SCH\_TRIM_{js}\)
is the
school-level weight
trimming adjustment
factor;
\(SCH\_TRIM_{js}\)
is the
school-level weight
trimming adjustment
factor;
![]() \(SCHSESWT_{js}\) is
the school-level
session assignment
weight that
reflects the
conditional probability,
given the
school, that
the particular
session type
was assigned to
the school; and
\(SCHSESWT_{js}\) is
the school-level
session assignment
weight that
reflects the
conditional probability,
given the
school, that
the particular
session type
was assigned to
the school; and
![]() \(SCH\_SUBJ\_AF_{js}\) is the small-school subject adjustment
factor.
\(SCH\_SUBJ\_AF_{js}\) is the small-school subject adjustment
factor.
For 2022, the school-level session assignment weight is always one because schools were only assigned to one session type.
The small-school subject adjustment accounts for very small schools that did not have enough participating students for every subject intended for the school. School weights for subjects that had at least one eligible student are inflated by this factor to compensate for schools of the same size that did not have any eligible students for those subjects and would not be represented otherwise.
The factor is equal to the inverse of the probability that a school of a given size had at least one eligible sampled student in a given subject:
\begin{equation} SCH\_SUBJ\_AF_{js} = \max \biggl(\dfrac{SF_{js}}{n_{s}},1 \biggr) \end{equation}
where
\(SF_{js}\) is the spiraling factor for the given subject; and
\(n_{s}\) is the within-school student sample size.
For example, if a school was to assess students in two subjects with a spiraling ratio of 1:1 (i.e., a spiraling factor of 2) but had only one eligible student, then the small-school subject adjustment would be equal to 2. The factor for schools not needing this adjustment was set equal to 1.
For the 2022 operational assessments, schools could be assigned to one of four sample types:
Grades 4 and 8 mathematics and reading except Puerto Rico,
Grade 8 civics and U.S. history,
Grades 4 and 8 mathematics (Puerto Rico),
Age 9 mathematics and reading long-term trend (LTT).
Students in schools participating in the grades 4 and 8 mathematics and reading assessments were assigned to mathematics and reading at the rates of 52 percent and 48 percent respectively at grade 4, and 50 percent for each subject at grade 8. Students in schools participating in the grade 8 civics and U.S. history assessments were assigned to civics and U.S. history at the rates of 49 percent and 51 percent respectively. Students in schools participating in the age 9 mathematics and reading assessments were assigned to mathematics and reading at rates of 50 percent for each subject. Puerto Rico had only one operational assessment, so all students in grades 4 and 8 assigned to the operational assessment were assigned to mathematics.
Overall, the school weights of 27 of the approximately 5,200 schools participating in the grade 4 mathematics and reading assessment sample were adjusted to compensate for schools that were too small to take part only in mathematics or only in reading. The small-school adjustment factors ranged from 1.03 to 2.07. For the grade 8 mathematics and reading assessment sample, seven of 5,200 schools had their school weights adjusted to compensate for their size. The small-school adjustment factor was 2.00. Only one out of 400 schools had its school weight adjusted for the LTT assessments in mathematics and reading to account for schools that were too small to participate in both subjects. The small-school adjustment factor of 2 was used. For the assessment sample in civics and U.S. history at grade 8, the adjustment factor was set equal to 1 for all schools.
NAEP Technical Documentation Computation of Full-Sample Student Weights
The full-sample or final student weight is the sampling weight used to derive NAEP student estimates of population and subpopulation characteristics for a specified grade (4 or 8) or age (9 or 13) and assessment subject (civics,
mathematics, reading, or U.S. history). The full-sample student weight reflects the number of students in the population that the sampled student represents for purposes of estimation. The summation of the final student weights over a particular student group provides an estimate of the total number of students in that group within the population.
The full-sample weight, which is used to produce survey estimates, is distinct from a replicate weight that is used to estimate variances of survey estimates. The full-sample weight is assigned to participating students and reflects the student base weight after the application of the various weighting adjustments. The full-sample weight \(FSTUWGT_{jsk}\) for student \(k\) from school \(s\) in stratum \(j\) can be expressed as
Computation of Base Weights
School and Student Nonresponse Weight Adjustments
School and Student Weight Trimming Adjustments
Student Weight Raking Adjustment
\begin{equation} FSTUWGT_{jsk} = STU\_BWT_{jsk} \times SCH\_NRAF_{js} \times STU\_NRAF_{jsk} \times \\ SCH\_TRIM_{js} \times STU\_TRIM_{jsk} \times STU\_RAKE_{jsk} , \end{equation}
where
![]() \(STU\_BWT_{jsk}\) is the student base weight;
\(STU\_BWT_{jsk}\) is the student base weight;
![]() \(SCH\_NRAF_{js}\) is the school-level nonresponse adjustment
factor;
\(SCH\_NRAF_{js}\) is the school-level nonresponse adjustment
factor;
![]() \(STU\_NRAF_{jsk}\) is the student-level nonresponse
adjustment factor;
\(STU\_NRAF_{jsk}\) is the student-level nonresponse
adjustment factor;
![]() \(SCH\_TRIM_{js}\) is the school-level weight trimming
adjustment factor;
\(SCH\_TRIM_{js}\) is the school-level weight trimming
adjustment factor;
![]() \(STU\_TRIM_{jsk}\) is
the student-level
weight trimming
adjustment factor;
and
\(STU\_TRIM_{jsk}\) is
the student-level
weight trimming
adjustment factor;
and
![]() \(STU\_RAKE_{jsk}\) is the student-level raking adjustment
factor.
\(STU\_RAKE_{jsk}\) is the student-level raking adjustment
factor.
School sampling strata for a given assessment vary by school type (public or private), assessment subject (civics, mathematics, reading, or U.S. history), and grade (4 or 8) or age (9 or 13). See the links below for descriptions of the school strata for the various assessments.
![]() State public school samples for mathematics and reading at
grades 4 and 8
State public school samples for mathematics and reading at
grades 4 and 8
![]() National private
school samples
for mathematics
and reading
at grades
4 and
8
National private
school samples
for mathematics
and reading
at grades
4 and
8
![]() National public school samples for civics and U.S. history at
grade 8
National public school samples for civics and U.S. history at
grade 8
![]() National private school samples for civics and U.S. history
at grade 8
National private school samples for civics and U.S. history
at grade 8
![]() National public
school samples
for mathematics
and reading
at ages
9 and
13
National public
school samples
for mathematics
and reading
at ages
9 and
13
![]() National private
school samples
for mathematics
and reading
at ages
9 and
13
National private
school samples
for mathematics
and reading
at ages
9 and
13
NAEP Technical Documentation Computation of Base Weights
Every sampled school and student received a base weight equal to the reciprocal of its probability of selection. Computation of a school base weight varies by
![]() type of
sampled school
(original or
substitute); and
type of
sampled school
(original or
substitute); and
![]() sampling frame (new school frame or not).
sampling frame (new school frame or not).
Computation of a student base weight reflects
![]() the student's
overall probability
of selection
accounting for
school and
student sampling;
the student's
overall probability
of selection
accounting for
school and
student sampling;
![]() assignment to session type at the school- and student-level;
and
assignment to session type at the school- and student-level;
and
![]() the student's assignment to a particular subject.
the student's assignment to a particular subject.
School Base Weights Student Base Weights
NAEP Technical Documentation School Base Weights
The school base weight for a sampled school is equal to the inverse of its overall probability of selection. The overall selection probability of a sampled school differs by the type of sampled school (original or substitute) and by the type of sampling frame (new school frame or not).
The overall selection probability of an originally selected school in a civics, mathematics, reading, or U.S. history sample is equal to its probability of selection from the NAEP public/private school frame.
The overall selection probability of a school from the new school frame in a civics, mathematics, reading, or U.S. history sample is the product of two quantities:
![]() the probability
of selection
of the
school's district
into the
new-school district
sample or
the Catholic
diocese into
the new-school
Catholic diocese
sample, and
the probability
of selection
of the
school's district
into the
new-school district
sample or
the Catholic
diocese into
the new-school
Catholic diocese
sample, and
![]() the probability of selection of the school into the new
school sample.
the probability of selection of the school into the new
school sample.
The new-school district sampling procedures for the 2022 national public school samples for the civics and U.S. history assessment at grade 8 are very similar to the new- school district sampling procedures for the 2022 state public schools assessments in mathematics and reading.
New-school Catholic diocese sampling procedures for the 2022 national private school assessments for mathematics and reading at grades 4 and 8 and for civics and U.S. history at grade 8 are similar as well.
For the mathematics and reading long-term trend (LTT) assessments at ages 9 and 13, the new-school district and Catholic diocese sampling procedures took advantage of the work already being done for the grade-based assessments.
Substitute schools are preassigned to original schools and take the place of original schools if they refuse to participate. For weighting purposes, substitute schools are treated as if they were the original schools they replaced, so substitute schools are assigned the school base weight of their corresponding original schools.
Learn more about substitute schools for the 2022 national public school assessments for civics and U.S. history at grade 8 and for mathematics and reading LTT assessments at age 9. The 2022 state public school assessment in mathematics and reading do not use substitute schools.
Learn more about substitute schools for the 2022 national private school assessments in mathematics and reading at grades 4 and 8, in civics and U.S. history at grade 8, and in mathematics and reading LTT assessments at ages 9 and 13.
NAEP Technical Documentation Student Base Weights
Every sampled student received a student base weight, whether or not the student participated in the assessment. The student base weight is the reciprocal of the probability that the student was sampled to participate in the assessment for a specified subject. The student base weight \(STU\_BWT_{jsk}\) for student \(k\) from school \(s\) in stratum \(j\) is the product of seven weighting components and can be expressed as
\begin{equation} STU\_BWT_{jsk} = SCH\_BWT_{js} \times SCHSESWT_{js} \times WINSCHWT_{js} \times \\ STUSESWT_{jsk} \times SUBJFAC_{jsk} \times SUBADJ_{js} \times YRRND\_AF_{js}, \end{equation}
where
![]() \(SCH\_BWT_{js}\) is the school base weight;
\(SCH\_BWT_{js}\) is the school base weight;
![]() \(SCHSESWT_{js}\) is
the school-level
session assignment
weight that
reflects the
conditional probability,
given the
school, that
the particular
session type
was assigned to
the school;
\(SCHSESWT_{js}\) is
the school-level
session assignment
weight that
reflects the
conditional probability,
given the
school, that
the particular
session type
was assigned to
the school;
![]() \(WINSCHWT_{js}\) is
the within-school
student weight
that reflects
the conditional
probability, given
the school,
that the
student was
selected for
the NAEP
assessment;
\(WINSCHWT_{js}\) is
the within-school
student weight
that reflects
the conditional
probability, given
the school,
that the
student was
selected for
the NAEP
assessment;
![]() \(STUSESWT_{jsk}\) is
the student-level
session assignment
weight that
reflects the
conditional probability,
given that
the particular
session type
was assigned
to the school,
that the student was assigned to the session type;
\(STUSESWT_{jsk}\) is
the student-level
session assignment
weight that
reflects the
conditional probability,
given that
the particular
session type
was assigned
to the school,
that the student was assigned to the session type;
![]() \(SUBJFAC_{jsk}\) is
Stu_factor the
subject spiral
adjustment factor
that reflects
the conditional
probability, given
that the
student was
assigned to
a particular
session type, that the student was assigned the specified
subject;
\(SUBJFAC_{jsk}\) is
Stu_factor the
subject spiral
adjustment factor
that reflects
the conditional
probability, given
that the
student was
assigned to
a particular
session type, that the student was assigned the specified
subject;
![]() \(SUBADJ_{js}\) is
the substitution
adjustment factor
to account
for the
difference in
enrollment size
between the
substitute and
original school;
and
\(SUBADJ_{js}\) is
the substitution
adjustment factor
to account
for the
difference in
enrollment size
between the
substitute and
original school;
and
![]() \(YRRND\_AF_{js}\) is
the year-round
adjustment factor
to account
for students
in year-round
schools on
scheduled break
at the
time of
the NAEP
assessment and
thus not available to be included in the sample.
\(YRRND\_AF_{js}\) is
the year-round
adjustment factor
to account
for students
in year-round
schools on
scheduled break
at the
time of
the NAEP
assessment and
thus not available to be included in the sample.
The within-school student weight \((WINSCHWT_{js})\) is the inverse of the student sampling rate in the school. For long-term trend (LTT), due to the oversampling of certain race/ethnicity student groups, some schools have two student sampling rates.
The subject spiral adjustment factor \((SUBJFAC_{jsk})\) adjusts the student weight to account for the spiral pattern used in distributing civics, mathematics, reading, or
U.S. history booklets to the students. The subject factor varies by grade (or age, for LTT) and subject; it is equal to the inverse of the booklet proportions (civics, mathematics, reading, or U.S. history) in the overall spiral for a specific sample.
For cooperating substitutes of nonresponding original sampled schools, the substitution adjustment factor \((SUBADJ_{js})\) is equal to the ratio of the estimated grade (or age-specific) enrollment for the original sampled school to the estimated grade (or age-specific) enrollment for the substitute school. The student sample from the substitute school then "represents" the set of grade-eligible (or age-eligible) students from the original sampled school.
The year-round adjustment factor \((YRRND\_AF_{js})\) adjusts the student weight for students in year-round schools who do not attend school during the time of the assessment. This situation typically arises in overcrowded schools. School administrators in year-round schools randomly assign students to portions of the year in which they attend school and portions of the year in which they do not attend. At the time of assessment, a certain percentage of students (designated as \(OFF_{js}\)) do not attend school and thus cannot be assessed. The \(YRRND\_AF_{js}\) for a school is calculated as \(1/(1 - OFF_{js}/100)\).
NAEP Technical Documentation School and Student Nonresponse Weight Adjustments
Nonresponse is unavoidable in any voluntary survey of a human population. Nonresponse leads to the loss of sample data that must be compensated for in the weights of the responding sample members. This differs from ineligibility, for which no adjustments are necessary. The purpose of the nonresponse adjustments is to reduce the mean square error of survey estimates. While the nonresponse adjustment reduces the bias from the loss of sample, it also increases variability among the survey weights leading to increased variances of the sample estimates. However, it is presumed that the reduction in bias more than compensates for the increase in the variance, thereby reducing the mean square error and thus improving the accuracy of survey estimates. Nonresponse adjustments are made in the NAEP surveys at both the school and the student levels: the responding (original and substitute) schools receive a weighting adjustment to compensate for nonresponding schools, and responding students receive a weighting adjustment to compensate for nonresponding students.
School Nonresponse Weight Adjustment
Student Nonresponse Weight Adjustment
The paradigm used for nonresponse adjustment in NAEP is the quasi-randomization approach (Oh and Scheuren, 1983). In this approach, school response cells are based on characteristics of schools known to be related to both response propensity and achievement level, such as the locale type (e.g., large principal city of a metropolitan area) of the school. Likewise, student response cells are based on characteristics of the schools containing the students and student characteristics that are known to be related to both response propensity and achievement level, such as student race/ethnicity, gender, and age.
Under this approach, sample members are assigned to mutually exclusive and exhaustive response cells based on predetermined characteristics. A nonresponse adjustment factor is calculated for each cell as the ratio of the sum of adjusted base weights for all eligible units to the sum of adjusted base weights for all responding units. The nonresponse adjustment factor is then applied to the base weight of each responding unit. In this way, the weights of responding units in the cell are "weighted up" to represent the full set of responding and nonresponding units in the response cell.
The quasi-randomization paradigm views nonresponse as another stage of sampling. Within each nonresponse cell, the paradigm assumes that the responding sample units are a simple random sample from the total set of all sample units. If this model is valid, then the use of the quasi-randomization weighting adjustment will eliminate any nonresponse bias. Even if this model is not valid, the weighting adjustments can eliminate bias if the achievement scores are homogeneous within the response cells. See, for example, chapter 4 of Little and Rubin (1987).
NAEP Technical Documentation School Nonresponse Weight Adjustment
The school nonresponse adjustment procedure inflates the weights of cooperating schools to account for eligible noncooperating schools for which no substitute schools participated. The adjustments are computed within nonresponse cells and are based on the assumption that the cooperating and noncooperating schools within the same cell are more similar to each other than to schools from different cells.
School nonresponse adjustments were carried out separately by sample; that is, by
![]() sample level
(state, national),
sample level
(state, national),
![]() school type
(public, private),
school type
(public, private),
![]() grade (4, 8) or age (9, 13), and
grade (4, 8) or age (9, 13), and
![]() assessment subject (civics, mathematics, reading, U.S.
history).
assessment subject (civics, mathematics, reading, U.S.
history).
Development of Initial School Nonresponse Cells
Development of Final School Nonresponse Cells
School Nonresponse Adjustment Factor Calculation
NAEP Technical Documentation Development of Final School Nonresponse Cells
Limits were placed on the magnitude of cell sizes and adjustment factors to prevent unstable nonresponse adjustments and unacceptably large nonresponse factors. All initial weighting cells with fewer than six cooperating schools or adjustment factors greater than 3.0 (or 4.0 for long-term trend [LTT]) for the full sample weight were collapsed with suitable adjacent cells. Simultaneously, all initial weighting cells for any replicate with fewer than four cooperating schools or adjustment factors greater than the maximum of
3.0 or two times the full sample nonresponse adjustment factor were collapsed with suitable adjacent cells. Initial weighting cells were generally collapsed in reverse order of the cell structure; that is, starting at the bottom of the nesting structure and working up toward the top level of the nesting structure.
State Public School Samples for Mathematics and Reading Assessments at Grades 4 and 8
For the grade 4 and 8 public school samples for mathematics and reading, cells with the most similar Black/Hispanic, achievement level, median income, or enrollment composition stratum within a given jurisdiction/Trial Urban District Assessment (TUDA) district and urbanicity (urban-centric locale) stratum were collapsed first. If further collapsing was required after all levels of the first variable were collapsed, cells with the most similar urbanicity strata were combined next. Cells were never permitted to be collapsed across jurisdictions or TUDA districts.
National Public School Samples for Civics and U.S. History Assessments at Grade 8
For the grade 8 public school civics and U.S. history sample, Black/Hispanic composition stratum cells within a given census division stratum and urbanicity stratum were collapsed first. If further collapsing was required after all levels of race/ethnicity classification were collapsed, cells with the most similar urbanicity strata were combined next. Any further collapsing occurred across census division strata but never across census regions.
National Public School Samples for Mathematics and Reading LTT Assessments at Ages 9 and 13
For the LTT public school samples for mathematics and reading, race/ethnicity classification cells within a given census region stratum and urbanicity stratum were collapsed first. Any further collapsing occurred across urbanicity strata but never across census regions.
National Private School Samples for Mathematics and Reading Assessments at Grades 4 and 8
For the grade 4 and 8 private school samples for mathematics and reading, cells with the most similar race/ethnicity classification within a given affiliation, census region, and urbanicity stratum were collapsed first. If further collapsing was required after all levels of race/ethnicity strata were collapsed, cells with the most similar urbanicity classification were combined. Any further collapsing occurred across census region strata but never across affiliations.
National Private School Samples for Civics and U.S. History Assessments at Grade 8
For the grade 8 private school civics and U.S. history samples, cells with the most similar race/ethnicity classification within a given affiliation, census region, and urbanicity stratum were collapsed first. If further collapsing was required after all levels of race/ethnicity strata were collapsed, cells with the most similar urbanicity classification were combined. Any further collapsing occurred across census region strata but never across affiliations.
National Private School Samples for Mathematics and Reading LTT Assessments at Ages 9 and 13
For the LTT private school samples for mathematics and reading, urbanicity strata within a given affiliation and census region were collapsed first. Any further collapsing occurred across census region strata but never across affiliations.
NAEP Technical Documentation Development of Initial School Nonresponse Cells
The cells for nonresponse adjustments are generally functions of the school sampling strata for the individual samples. School sampling strata usually differ by assessment subject, grade (or age for long-term trend [LTT]), and school type (public or private). Assessment subjects that are administered together by way of spiraling have the same school samples and stratification schemes. Subjects that are not spiraled with any other subjects have their own separate school sample. In NAEP 2022, the following assessments were spiraled together:
![]() mathematics and
reading assessments
at grades
4 and
8;
mathematics and
reading assessments
at grades
4 and
8;
![]() civics and U.S. history assessments at grade 8; and
civics and U.S. history assessments at grade 8; and
![]() mathematics and reading LTT
assessments at ages 9 and 13.
mathematics and reading LTT
assessments at ages 9 and 13.
The initial nonresponse cells for the various NAEP 2022 samples are described below.
State Public School Samples for Mathematics and Reading Assessments at Grades 4 and 8
For these samples, initial weighting cells were formed within each jurisdiction and grade using the following nesting cell structure:
![]() Trial Urban
District Assessment
(TUDA) district
vs. the
balance of
the state
for states
with TUDA
districts;
Trial Urban
District Assessment
(TUDA) district
vs. the
balance of
the state
for states
with TUDA
districts;
![]() urbanicity (urban-centric locale)
stratum; and
urbanicity (urban-centric locale)
stratum; and
![]() race/ethnicity classification stratum, achievement level,
median income, or grade enrollment.
race/ethnicity classification stratum, achievement level,
median income, or grade enrollment.
In general, the nonresponse cell structure used race/ethnicity classification stratum as the lowest level variable. However, where there was only one race/ethnicity classification stratum within a particular urbanicity stratum, then categorized achievement, median income, or enrollment data was used instead.
National Public School Samples for Civics and U.S. History Assessments at Grade 8 The initial weighting cells for these samples were formed using the following nesting cell structure:
![]() census division stratum;
census division stratum;
![]() urbanicity stratum
(urban-centric locale);
and
urbanicity stratum
(urban-centric locale);
and
![]() Black/Hispanic composition stratum.
Black/Hispanic composition stratum.
National Public School Sample for Mathematics and Reading LTT Assessments at Ages 9 and 13
The initial weighting cells for these samples were formed using the following nesting cell structure:
![]() census division stratum;
census division stratum;
![]() urbanicity stratum (four categories based on urban-centric
locale); and
urbanicity stratum (four categories based on urban-centric
locale); and
![]() race/ethnicity
classification
(categories based
on the
total percentage
of Black,
Hispanic, and
American Indian/Alaska
Native students).
race/ethnicity
classification
(categories based
on the
total percentage
of Black,
Hispanic, and
American Indian/Alaska
Native students).
National Private School Samples for Mathematics and Reading Assessments at Grades 4 and 8
The initial weighting cells for these samples were formed within each grade using the following nesting cell structure:
![]() affiliation;
affiliation;
![]() census region stratum;
census region stratum;
![]() urbanicity stratum
(urban-centric locale);
and
urbanicity stratum
(urban-centric locale);
and
![]() race/ethnicity classification stratum.
race/ethnicity classification stratum.
National Private School Samples for Civics and U.S. History Assessments at Grade 8 The initial weighting cells for these samples were formed using the following nesting cell structure:
![]() affiliation;
affiliation;
![]() census region stratum;
census region stratum;
![]() urbanicity stratum
(urban-centric locale);
and
urbanicity stratum
(urban-centric locale);
and
![]() race/ethnicity classification stratum.
race/ethnicity classification stratum.
National Private School Samples for Mathematics and Reading LTT Assessments at Ages 9 and 13
The initial weighting cells for these samples were formed using the following nesting cell structure:
![]() affiliation;
affiliation;
![]() census region stratum; and
census region stratum; and
![]() urbanicity stratum (four categories based on urban-centric
locale.
urbanicity stratum (four categories based on urban-centric
locale.
NAEP Technical Documentation School Nonresponse Adjustment Factor Calculation
In each final school nonresponse adjustment cell \(c\), the school nonresponse adjustment factor \(SCH\_NRAF_{c}\) was computed as
\begin{equation} SCH\_NRAF_{c} = \dfrac { \sum_{ s \in S_{c}} { SCH\_BWT_{s} \times SCH\_TRIM_{s} \times SCHSESWT_{s} \times X_{s}} } { \sum_{ s \in R_{c}}
{ SCH\_BWT_{s} \times SCH\_TRIM_{s} \times SCHSESWT_{s} \times X_{s}} }, \end{equation} where
![]() \(S_{c}\) is
the set
of all
eligible sampled
schools (cooperating
original and
substitute schools
and refusing
original schools
with noncooperating
or no
assigned substitute) in cell \(c\),
\(S_{c}\) is
the set
of all
eligible sampled
schools (cooperating
original and
substitute schools
and refusing
original schools
with noncooperating
or no
assigned substitute) in cell \(c\),
![]() \(R_{c}\) is
the set
of all
cooperating schools
within \(S_{c}\),
\(R_{c}\) is
the set
of all
cooperating schools
within \(S_{c}\),
![]() \(SCH\_BWT_{s}\) is the school base weight,
\(SCH\_BWT_{s}\) is the school base weight,
![]() \(SCH\_TRIM_{s}\) is the school-level weight trimming factor,
\(SCH\_TRIM_{s}\) is the school-level weight trimming factor,
![]() \(SCHSESWT_{s}\) is
the school-level
session assignment
weight that
reflects the
conditional probability,
given the
school, that
the particular
assessment type
was assigned to the school, and
\(SCHSESWT_{s}\) is
the school-level
session assignment
weight that
reflects the
conditional probability,
given the
school, that
the particular
assessment type
was assigned to the school, and
![]() \(X_{s}\) is
the estimated
grade enrollment
(or age-specific
enrollment for
long-term trend
[LTT]) corresponding
to the
original sampled
school.
\(X_{s}\) is
the estimated
grade enrollment
(or age-specific
enrollment for
long-term trend
[LTT]) corresponding
to the
original sampled
school.
NAEP Technical Documentation Student Nonresponse Weight Adjustment
The student nonresponse adjustment procedure inflates the weights of assessed students to account for eligible sampled students who did not participate in the assessment. These inflation factors offset the loss of data associated with absent students. The adjustments are computed within nonresponse cells and are based on the assumption that the assessed and absent students within the same cell are more similar to one another than to students from different cells. Like its counterpart at the school level, the student nonresponse adjustment is intended to reduce the mean square error and thus improve the accuracy of NAEP assessment estimates. Also, like their counterparts at the school level, student nonresponse adjustments were carried out separately by sample; that is, by
![]() grade (4, 8) or age (9, 13),
grade (4, 8) or age (9, 13),
![]() school type (public, private), and
school type (public, private), and
![]() assessment subject (civics, mathematics, reading, U.S.
history).
assessment subject (civics, mathematics, reading, U.S.
history).
Development of Initial Student Nonresponse Cells
Development of Final Student Nonresponse Cells
Student Nonresponse Adjustment Factor Calculation
NAEP Technical Documentation Development of Final Student Nonresponse Cells
Similar to the school nonresponse adjustment, cell and adjustment factor size constraints are in place to prevent unstable nonresponse adjustments or unacceptably large adjustment factors. All initial weighting cells with either fewer than 20 participating students or adjustment factors greater than 2.0 for the full sample weight were collapsed with suitable adjacent cells. Simultaneously, all initial weighting cells for any replicate with either fewer than 15 participating students or an adjustment factor greater than the maximum of 2.0 or 1.5 times the full sample nonresponse adjustment factor were collapsed with suitable adjacent cells.
Initial weighting cells were generally collapsed in reverse order of the cell structure; that is, starting at the bottom of the nesting structure and working up toward the top level of the nesting structure. Race/ethnicity cells within students with disabilities (SD) and English learners (EL) groups, school nonresponse cell, age for grade-based assessments or grade for long-term trend (LTT) age-based assessments, and gender classes were collapsed first. If further collapsing was required after collapsing all race/ethnicity classes, cells were next combined across gender, then age for grade-based or grade for age-based assessments, and finally school nonresponse cells. Cells are never collapsed across SD and EL groups for any sample.
NAEP Technical Documentation Development of Initial Student Nonresponse Cells
Initial student nonresponse cells are generally created within each sample as defined by grade (or age), school type (public or private), and assessment subject (civics, mathematics, reading, or U.S. history). However, when subjects are administered together by way of spiraling, the initial student nonresponse cells are created across the subjects in the same spiral. The rationale behind this decision is that spiraled subjects are in the same schools and the likelihood that an eligible student participates in an assessment is more related to its school than the assessment subject. Nonresponse adjustment procedures are not applied to excluded students or full-time remote students because they are not required to complete an assessment. Full-time remote students are enrolled in brick-and-mortar schools but do not attend school in person.
The initial student nonresponse cells for the various NAEP 2022 samples are described below.
State Public School Samples for Mathematics and Reading Assessments at Grades 4 and 8
The initial
student nonresponse
cells for
these samples
were defined
within grade,
jurisdiction, and
Trial Urban
District Assessment
(TUDA) district
hierarchically as
follows:
![]() Students with disabilities (SD)/English learners (EL) by
subject;
Students with disabilities (SD)/English learners (EL) by
subject;
![]() school nonresponse cell;
school nonresponse cell;
![]() age (classified
into "older"1
student and
"modal age
or younger"
student);
age (classified
into "older"1
student and
"modal age
or younger"
student);
![]() gender; and
gender; and
![]() race/ethnicity.
race/ethnicity.
The highest level variable in the cell structure separates students who were classified either as SD or EL from those who are neither, since SD and EL students tend to score lower on assessment tests than non-SD/non-EL students. In addition, the students in the SD or EL groups are further broken down by subject, since rules for excluding students from the assessment generally differ by subject. Non-SD and non-EL students are not broken down by subject, since the exclusion rules do not apply to them.
National Public School Samples for Civics and U.S. History Assessments at Grade 8
The initial
student nonresponse
cells for
these samples
were defined
using the
following nesting
structure:
![]() SD/EL by subject;
SD/EL by subject;
![]() school nonresponse cell;
school nonresponse cell;
![]() age (classified
into "older"
student and
"modal age
or younger"
student);
age (classified
into "older"
student and
"modal age
or younger"
student);
![]() gender; and
gender; and
![]() race/ethnicity.
race/ethnicity.
National Public School Samples for Mathematics and Reading LTT Assessments at Ages 9 and 13
The initial
student nonresponse
cells for
these samples
were defined
using the
following nesting
structure:
![]() SD/EL by subject;
SD/EL by subject;
![]() school nonresponse cell;
school nonresponse cell;
![]() categorized grade
(classified into
"lower" and
"upper" grade);
categorized grade
(classified into
"lower" and
"upper" grade);
![]() gender; and
gender; and
![]() race/ethnicity.
race/ethnicity.
National Private School Samples for Mathematics and Reading Assessments at Grades 4 and 8
The initial
weighting cells
for these
private school
samples were
formed using
the following
nesting structure
within grade:
![]() SD/EL;
SD/EL;
![]() school nonresponse cell;
school nonresponse cell;
![]() age (classified
into "older"
student and
"modal age
or younger"
student);
age (classified
into "older"
student and
"modal age
or younger"
student);
![]() gender; and
gender; and
![]() race/ethnicity.
race/ethnicity.
Although exclusion rules differ by subject, there were not enough SD or EL private school students to break out by subject as was done for the public schools.
National Private School Samples for Civics and U.S. History Assessments at Grade 8
The initial
weighting cells
for these
private school
samples were
formed using
the following
nesting structure:
![]() SD/EL;
SD/EL;
![]() school nonresponse cell;
school nonresponse cell;
![]() age (classified
into "older"
student and
"modal age
or younger"
student);
age (classified
into "older"
student and
"modal age
or younger"
student);
![]() gender; and
gender; and
![]() race/ethnicity.
race/ethnicity.
National Private School Samples for Mathematics and Reading LTT Assessments at Ages 9 and 13
The initial weighting cells for these private school samples were formed using the following nesting structure:
school
nonresponse cell;
 categorized
grade (classified
into "lower"
and "upper"
grade); gender; and
categorized
grade (classified
into "lower"
and "upper"
grade); gender; and
race/ethnicity.
1 1 Older students are those born before October 1, 2011 for grade 4 and before October 1, 2007, for grade 8.
NAEP Technical Documentation Student Nonresponse Adjustment Factor Calculation
In each final student nonresponse adjustment cell \(c\) for a given sample, the student nonresponse adjustment factor \(STU\_NRAF_{c}\) was computed as
\begin{equation} STU\_NRAF_{c} = \dfrac { \sum_{ k \in S_{c}} \dfrac { STU\_BWT_{k} \times SCH\_TRIM_{k} \times SCH\_NRAF_{k} } {SUBJFAC_{k}} } { \sum_{ k \in R_{c}} \dfrac { STU\_BWT_{k} \times SCH\_TRIM_{k} \times SCH\_NRAF_{k} } {SUBJFAC_{k}} }, \end{equation}
where
![]() \(S_{c}\) is
the set
of all
eligible sampled
students in
cell \(s\)
for a
given sample;
\(S_{c}\) is
the set
of all
eligible sampled
students in
cell \(s\)
for a
given sample;
![]() \(R_{c}\) is the set of all assessed students within
\(S_{c}\);
\(R_{c}\) is the set of all assessed students within
\(S_{c}\);
![]() \(STU\_BWT_{k}\) is the student base weight for a given
student \(k\);
\(STU\_BWT_{k}\) is the student base weight for a given
student \(k\);
![]() \(SCH\_TRIM_{k}\) is the school-level weight trimming factor
for the school associated with student \(k\);
\(SCH\_TRIM_{k}\) is the school-level weight trimming factor
for the school associated with student \(k\);
![]() \(SCH\_NRAF_{k}\) is
the school-level
nonresponse adjustment
factor for
the school
associated with
student \(k\);
and
\(SCH\_NRAF_{k}\) is
the school-level
nonresponse adjustment
factor for
the school
associated with
student \(k\);
and
![]() \(SUBJFAC_{k}\) is the subject factor for student \(k\).
\(SUBJFAC_{k}\) is the subject factor for student \(k\).
The student weight used in the calculation above is the adjusted student base weight, without regard to subject, adjusted for school weight trimming and school nonresponse.
Nonresponse adjustment procedures are not applied to excluded students or full-time remote students because these students are not required to complete an assessment. In effect, these students were placed in a separate nonresponse cell by themselves, and all received an adjustment factor of 1. While these students are not included in the analysis of the NAEP scores, weights are provided for them in order to estimate the sizes of these groups and their population characteristics.
NAEP Technical Documentation School and Student Weight Trimming Adjustments
Weight trimming is an adjustment procedure that involves detecting and reducing extremely large weights. "Extremely large weights"
generally refer to large sampling weights that were not anticipated in the design of the sample. Unusually large weights are likely to produce large sampling variances for statistics of interest, especially when the large weights are associated with sample cases reflective of rare or atypical characteristics. To reduce the impact of these large weights on variances, weight reduction methods are typically employed. The goal of employing weight reduction methods is to reduce the mean square error of survey estimates. While the trimming of large weights reduces variances, it also introduces some bias. However, it is presumed that the reduction in the variances more than compensates for the increase in the bias, thereby reducing the mean square error and thus improving the accuracy of survey estimates (Potter, 1988). NAEP employs weight trimming at both
the school and student levels.
Trimming of School Base Weights
Trimming of Student Weights
NAEP Technical Documentation Trimming of School Base Weights
Unusually large school weights can occur under three circumstances:
New Schools: When a school selected from the NAEP new-school sampling frame has an enrollment that is disproportionately large relative to the enrollment of its corresponding school district or Catholic diocese. In other words, when a large new school is selected from a small school district or Catholic diocese.
Private Schools: When a school from the private school frame participates in NAEP but did not participate in the Private School Universe Survey (PSS), the source of the NAEP private school frame. Schools that fall into this category are referred to as PSS nonrespondents and have small probabilities of selection.
Schools with Large Enrollment Increases: When the actual grade enrollment of a school, determined at the time of student sampling, is grossly larger than its enrollment used for school sampling.
If a school's base weight was determined to be too large, the school weight was trimmed. Recall schools were sampled for NAEP with probability proportional to size where size was based on student grade enrollment. If a sampled school had a small grade enrollment, its school base weight was large. To determine if a school's base weight was too large, a comparison was made between a school's base weight and its ideal weight (described below). If a school's base weight was more than three times its ideal weight, the school's base weight was scaled back or trimmed to three times the ideal weight. The trimming was accomplished by way of a trimming factor. The trimming factor for school \ (s\) was calculated using the formula
\begin{equation} SCH\_TRIM_{s} = \left\{\begin{array}{llll} \dfrac{3 \times EXP\_WT_{s}} {SCH\_BWT_{s}} & \text{if } \dfrac{ SCH\_BWT_{s}} { EXP\_WT_{s}}
>3 \\ 1 & \text{otherwise } \\ \end{array}\right. , \end{equation} where
![]() \(EXP\_WT_{s}\) is the ideal base weight for school \(s\); and
\(EXP\_WT_{s}\) is the ideal base weight for school \(s\); and
![]() \(SCH\_BWT_{s}\) is the actual school
base weight for school \(s\).
\(SCH\_BWT_{s}\) is the actual school
base weight for school \(s\).
The ideal weight for a school depends on the type of circumstance: whether it was a new school, private school, or school with large grade enrollment increase. Details of the trimming procedure by type of circumstance are described below.
New Schools
New schools with a disproportionately large student enrollment in a particular grade from a school district (or Catholic diocese) that was selected with a small probability of selection were likely candidates to have their school weights trimmed. The school base weights for such schools may be large relative to what they would have been if they had been selected from the NAEP public or private school sampling frame. The ideal weight for a new school was as follows:
![]() \(EXP\_WT_{s}\) is
the ideal
base weight
the school
would have
received if
it had
been on
the NAEP
public or
private school
sampling frame.
\(EXP\_WT_{s}\) is
the ideal
base weight
the school
would have
received if
it had
been on
the NAEP
public or
private school
sampling frame.
For the 2022 NAEP assessment, two grade 8 schools out of 73 participating schools selected from the new-school sampling frame had their weights trimmed.
Private Schools
Private school PSS nonrespondents who participated in NAEP and were found subsequently to have either larger enrollments than assumed at the time of school sampling or an atypical probability of selection given their affiliation, the latter being unknown at the time of sampling, were also likely candidates to have their school weights trimmed. The ideal weight for a PSS nonresponding private school was as follows:
![]() \(EXP\_WT_{s}\) is
the ideal
base weight
the school
would have
received if
it had
been on
the NAEP
private school
sampling frame
with accurate
enrollment and
known affiliation.
\(EXP\_WT_{s}\) is
the ideal
base weight
the school
would have
received if
it had
been on
the NAEP
private school
sampling frame
with accurate
enrollment and
known affiliation.
For the 2022 NAEP assessment, there were three private school PSS nonrespondents that participated in NAEP, and none had their weights trimmed.
Schools with Large Enrollment Increases
Schools, other than the PSS nonrespondents described above, whose enrollments determined at the time of student sampling were much larger than those assumed at the time of school sampling were also candidates to have their school weights trimmed. These schools have large relative school weights because their school probabilities of selection were artificially low. The ideal weight for a school with a large grade enrollment increase was as follows:
![]() \(EXP\_WT_{s}\) is
the ideal
base weight
the school
would have
received if
it had
been on
the relevant
NAEP public
or private
school sampling
frame with
the updated
enrollment figure from student sampling.
\(EXP\_WT_{s}\) is
the ideal
base weight
the school
would have
received if
it had
been on
the relevant
NAEP public
or private
school sampling
frame with
the updated
enrollment figure from student sampling.
For the 2022 NAEP assessment, one school at grade 8 with a large grade enrollment increase had its weight trimmed.
Note that for the long-term trend (LTT) assessments, age-specific enrollment was used in the trimming procedure instead of grade enrollment. No LTT schools had their weights trimmed.
NAEP Technical Documentation Trimming of Student Weights
Large student weights generally come from compounding nonresponse adjustments at the school and student levels with artificially low school selection probabilities, which can result from inaccurate enrollment data on the school frame used to define the school size measure. Even though measures are in place to limit the number and size of excessively large weights—such as the implementation of adjustment factor size constraints in both the school and student nonresponse procedures and the use of the school trimming procedure—large student weights can occur due to compounding effects of the various weighting components.
The student weight trimming procedure uses a multiple median rule to detect excessively large student weights. Any student weight within a given trimming group greater than a specified multiple of the median weight value of the given trimming group has its weight scaled back to that threshold. Student weight trimming was implemented separately by grade (or age, in the case of long-term trend [LTT]), school type (public or private), and subject. Initially, the threshold was set to 3.5. If too many student weights were being trimmed for a particular sample, the threshold was increased to reduce the number of records trimmed. The multiples and the trimming groups are defined for each sample below. Note that because in the initial runs of the national private school samples for mathematics and reading at grades 4 and 8 too many records were getting their weights trimmed, the threshold in those samples was increased to 4.5.
State Public School Samples for Mathematics and Reading at Grades 4 and 8
For these samples, the initial multiple used was 3.5, and the trimming groups were formed within each jurisdiction by Trial Urban District Assessment (TUDA) district vs. the balance of the state for states with TUDA districts.
National Private School Samples for Mathematics and Reading at Grades 4 and 8
For these samples, the initial multiple used was 4.5, and the trimming groups were formed by affiliation (Catholic, Non-Catholic).
National Public School Samples for Civics and U.S. History at Grade 8
For these samples, the initial multiple used was 3.5, and the trimming groups were formed by dichotomies of low/high percentage of American Indian/Alaska Native students (5 percent and below, above 5 percent) and Black and Hispanic students (15 percent and below, above 15 percent).
National Private School Samples for Civics and U.S. History at Grade 8
For these samples, the initial multiple used was 3.5, and the trimming groups were formed by affiliation (Catholic, Non-Catholic).
National Public School Samples for Mathematics and Reading LTT Assessments at Ages 9 and 13
For these samples, the initial multiple used was 3.5, and the trimming groups were defined by region and school oversampling factor for public schools. The school oversampling factor separated, into different trimming groups, schools that had different probabilities of selection by design due to the desire to increase the numbers of Black, Hispanic, and American Indian/Alaska Native students in the sample.
National Private School Samples for Mathematics and Reading LTT Assessments at Ages 9 and 13
For these samples, the initial multiple used was 3.5, and the trimming groups were formed by affiliation (Catholic, Non-Catholic).
The procedure computes the median of the nonresponse-adjusted student weights in the trimming group \(g\) for a given grade (or age) and subject sample. Any student \(k\) with a weight more than \(M\) times the median received a trimming factor calculated as
\begin{equation} STU\_TRIM_{gk} = \left\{\begin{array}{llll} \dfrac{M \times MEDIAN_{g}} {STUWGT_{gk}} & \text{if } STUWGT_{gk} < M \times MEDIAN_{g} \\ 1 & \text{otherwise } \\ \end{array}\right. , \end{equation}
where
![]() \(M\) is the trimming multiple,
\(M\) is the trimming multiple,
![]() \(MEDIAN_{g}\) is the median of nonresponse-adjusted student
weights in trimming group \(g\), and
\(MEDIAN_{g}\) is the median of nonresponse-adjusted student
weights in trimming group \(g\), and
![]() \(STUWGT_{gk}\) is the weight after student nonresponse
adjustment for student in trimming group \(g\).
\(STUWGT_{gk}\) is the weight after student nonresponse
adjustment for student in trimming group \(g\).
In the 2022 assessment, very few students had weights considered excessively large. Out of the approximately 483,700 students included in the combined grade- based 2022 assessment samples, 35 students had their weights trimmed. None of the approximately 33,500 LTT students had their weights trimmed.
NAEP Technical Documentation Student Weight Raking Adjustment
Weighted estimates of population totals for student-level subgroups for a given grade will vary across subjects even though the student samples for each subject generally come from the same schools. These differences are the result of sampling error associated with the random assignment of subjects to students through a process known as spiraling. For state assessments in particular, any difference in demographic estimates between subjects, no matter how small, may raise concerns about data quality. To remove these random differences and potential data quality concerns, a step was added to the NAEP weighting procedure in 2009. This step adjusts the student weights in such a way that the weighted sums of
Development of Final Raking Dimensions Raking Adjustment Control Totals
Raking Adjustment Factor Calculation
population totals for specific student groups are the same across all subjects. It was implemented using a raking procedure and applied only to public school assessments.
Raking is a weighting procedure based on the iterative proportional fitting process developed by Deming and Stephan (1940) and involves simultaneous ratio adjustments to two or more marginal distributions of population totals. Each set of marginal population totals is known as a dimension, and each population total in a dimension is referred to as a control total. Raking is carried out in a sequence of adjustments. Sampling weights are adjusted to one marginal distribution and then to the second marginal distribution, and so on. One cycle of sequential adjustments to the marginal distributions is called an iteration. The procedure is repeated until convergence is achieved. The criterion for convergence can be specified either as the maximum number of iterations or an absolute difference (or relative absolute difference) from the marginal population totals. More discussion on raking can be found in Oh and Scheuren (1987).
For NAEP 2022, the student raking adjustment was carried out for each public student sample. Similar to previous years, raking was not performed for any of the private school student samples or for student samples in the long-term trend (LTT) assessments at age 9. The dimensions used in the raking process for each public school student sample were race/ethnicity, gender, and student disability (SD) and English learner (EL) status. (Since 2013, National School Lunch Program [NSLP] eligibility has not been used as a raking dimension because of the instability of these data in many states.)
For the public school student samples in mathematics and reading at grades 4 and 8, the student raking adjustment was carried out separately in each state and TUDA district. The control totals for the raking dimensions for these student samples were obtained from the NAEP student sample weights of the mathematics and reading public samples combined.
For the public school student samples in civics and U.S. history at grade 8, the student raking adjustment was carried out at the national level. The control totals for the raking dimensions for these samples were obtained by summing the NAEP grade 8 student sample weights of the mathematics and reading public samples combined.
NAEP Technical Documentation Development of Final Raking Dimensions
The raking procedure involved three dimensions. The variables used to define the dimensions are listed below along with the categories making up the initial raking cells for each dimension.
Race/Ethnicity
White, not Hispanic
Black, not Hispanic
Hispanic
Asian
American Indian/Alaska Native
Native Hawaiian/Pacific Islander
Two or More Races
Student disability (SD)/English learner (EL) status
SD, but not EL
EL, but not SD
SD and EL
Neither SD nor EL
Gender
Male
Female
For the reading and mathematics samples, in states containing districts that participated in Trial Urban District Assessments (TUDA) at grades 4 and 8, the initial cells were created separately for each TUDA district and the balance of the state. For the civics and U.S. history samples at grade 8, the initial cells were created at the national level. Similar to the procedure used for school and student nonresponse adjustments, limits were placed on the magnitude of the cell sizes and adjustment factors to prevent unstable raking adjustments that could have resulted in unacceptably large or small adjustment factors. Levels of a dimension were combined whenever 1) there were fewer than 30 assessed, excluded, or full-time remote students (20 for any of the replicates) in a category, 2) the smallest adjustment was less than 0.5, or 3) the largest adjustment was greater than 2 for the full sample or for any replicate.
If collapsing was necessary for the race/ethnicity dimension, individual groups with similar student achievement levels were combined first. If further collapsing was necessary, the next closest race/ethnicity group was combined as well, and so on until all collapsing rules were satisfied. In some instances, all seven categories had to be collapsed.
If collapsing was necessary for the SD/EL dimension, the SD/not EL and SD/EL categories were combined first, followed by EL/not SD if further collapsing was necessary. In some instances, all four categories had to be collapsed.
Collapsing gender is generally not expected. However, in the rare event that it is necessary, male and female categories would be collapsed.
NAEP Technical Documentation Raking Adjustment Control Totals
The control totals used in the raking procedure for NAEP 2022 at grades 4 and 8 were estimates of the student population derived from the set of assessed, excluded, and full- time remote students pooled across subjects (mathematics and reading). The control totals for category \(c\) within dimension \(d\) were computed as
\begin{equation} TOTAL_{c(d)} = \sum_{ R_{c(d)} \smile E_{c(d)}} \dfrac { STU\_BWT_{k} \times SCH\_TRIM_{k} \times SCH\_NRAF_{k} \times STU\_NRAF_{k} }
{SUBJFAC_{k}}, \end{equation} where
![]() \(R_{c(d)}\) is the set of all assessed students in category
\(c\) of dimension \(d\);
\(R_{c(d)}\) is the set of all assessed students in category
\(c\) of dimension \(d\);
![]() \(E_{c(d)}\) is
the set
of all
excluded or
full-time remote
students in
category \(c\)
of dimension
\(d\);
\(E_{c(d)}\) is
the set
of all
excluded or
full-time remote
students in
category \(c\)
of dimension
\(d\);
![]() \(STU\_BWT_{k}\) is the student base weight for a given
student \(k\);
\(STU\_BWT_{k}\) is the student base weight for a given
student \(k\);
![]() \(SCH\_TRIM_{k}\) is the school-level weight trimming factor
for the school associated with student \(k\);
\(SCH\_TRIM_{k}\) is the school-level weight trimming factor
for the school associated with student \(k\);
![]() \(SCH\_NRAF_{k}\) is
the school-level
nonresponse adjustment
factor for
the school
associated with
student \(k\);
\(SCH\_NRAF_{k}\) is
the school-level
nonresponse adjustment
factor for
the school
associated with
student \(k\);
![]() \(STU\_NRAF_{k}\) is the student-level nonresponse adjustment
factor for student \(k\); and
\(STU\_NRAF_{k}\) is the student-level nonresponse adjustment
factor for student \(k\); and
![]() \(SUBJFAC_{k}\) is the subject factor for student \(k\).
\(SUBJFAC_{k}\) is the subject factor for student \(k\).
The student weight used in the calculation of the control totals above is the student base weight, without regard to subject, adjusted for school weight trimming, school nonresponse, and student nonresponse. Control totals were computed for the full sample and for each replicate independently.
NAEP Technical Documentation Raking Adjustment Factor Calculation
For assessed, excluded, and full-time remote students in a given subject, the raking adjustment factor \(STU\_RAKE_{k}\) was computed as below. First, the weight for student \(k\) was initialized as
\begin{equation} STUSAWT_{k}^{adj(0)} = STU\_BWT_{k} \times SCH\_TRIM_{k} \times SCH\_NRAF_{k} \times STU\_NRAF_{k} \times SUBJFAC_{k} ,
\end{equation} where
![]() \(STU\_BWT_{k}\) is the student base weight for a given
student \(k\);
\(STU\_BWT_{k}\) is the student base weight for a given
student \(k\);
![]() \(SCH\_TRIM_{k}\) is the school-level weight trimming factor
for the school associated with student \(k\);
\(SCH\_TRIM_{k}\) is the school-level weight trimming factor
for the school associated with student \(k\);
![]() \(SCH\_NRAF_{k}\) is
the school-level
nonresponse adjustment
factor for
the school
associated with
student \(k\);
\(SCH\_NRAF_{k}\) is
the school-level
nonresponse adjustment
factor for
the school
associated with
student \(k\);
![]() \(STU\_NRAF_{k}\) is the student-level nonresponse adjustment
factor for student \(k\); and
\(STU\_NRAF_{k}\) is the student-level nonresponse adjustment
factor for student \(k\); and
![]() \(SUBJFAC_{k}\) is the subject factor for student \(k\).
\(SUBJFAC_{k}\) is the subject factor for student \(k\).
Then, the sequence of weights for the first iteration was calculated as follows for student \(k\) in category \(c\) of dimension \(d\):
for dimension 1: \begin{equation} STUSAWT_{k}^{adj(1)} = \dfrac {TOTAL_{c(1)}} { \sum_{ R_{c(1)} \smile E_{c(1)}} {STUSAWT_{k}^{adj(0)} } } \times STUSAWT_{k}^{adj(0)} , \end{equation}
for dimension 2: \begin{equation} STUSAWT_{k}^{adj(2)} = \dfrac {TOTAL_{c(2)}} { \sum_{ R_{c(2)} \smile E_{c(2)}} {STUSAWT_{k}^{adj(1)} } } \times STUSAWT_{k}^{adj(1)} , \end{equation}
for dimension 3: \begin{equation} STUSAWT_{k}^{adj(3)} = \dfrac {TOTAL_{c(3)}} { \sum_{ R_{c(3)} \smile E_{c(3)}} {STUSAWT_{k}^{adj(2)} } } \times STUSAWT_{k}^{adj(2)} , \end{equation}
where
![]() \(R_{c(d)}\) is the set of all assessed students in category
\(c\) of dimension \(d\);
\(R_{c(d)}\) is the set of all assessed students in category
\(c\) of dimension \(d\);
![]() \(E_{c(d)}\) is
the set
of all
excluded or
full-time remote
students in
category \(c\)
of dimension
\(d\); and
\(E_{c(d)}\) is
the set
of all
excluded or
full-time remote
students in
category \(c\)
of dimension
\(d\); and
![]() \(TOTAL_{c(d)}\) is the control total for category \(c\) of
dimension \(d\).
\(TOTAL_{c(d)}\) is the control total for category \(c\) of
dimension \(d\).
The process is said to converge if the maximum difference between the sum of adjusted weights and the control totals is 1.0 for each category in each dimension. If after the sequence of adjustments the maximum difference was greater than 1.0, the process continues to the next iteration, cycling back to the first dimension with the initial weight for student \(k\) equaling \(STUSAWT_{k}^{adj(3)}\) from the previous iteration. The process continued until convergence was reached.
Once the process converged, the adjustment factor was computed as
\begin{equation} STU\_RAKE_{k} = \dfrac {STUSAWT_{k}} { STU\_BWT_{k} \times SCH\_TRIM_{k} \times SCH\_NRAF_{k} \times STU\_NRAF_{k} \times SUBJFAC_{k} } , \end{equation}
where
 \(STUSAWT_{k}\)
is the
weight for
student \(k\)
after convergence.
\(STUSAWT_{k}\)
is the
weight for
student \(k\)
after convergence.
The process was done independently for the full sample and for each replicate.
NAEP Technical Documentation Computation of Replicate School Weights
In addition to the full-sample weight, a set of 62 replicate weights was provided for each school. These replicate weights are used in calculating the sampling variance of estimates obtained from the data, using the jackknife repeated replication method. The method of deriving these weights was aimed at reflecting the features of the sample design appropriately for each sample, so that when the jackknife variance estimation procedure is implemented, approximately unbiased estimates of sampling variance are obtained. This section gives the specifics for generating the replicate weights for the 2022 assessment samples.
The theory that underlies the jackknife variance estimators used in NAEP studies is discussed in the section Replicate Variance Estimation.
For each sample, replicates were formed in two steps. First, each school was assigned to one or more of 62 replicate strata. This step differed for the age-based long-term trend (LTT) samples and the grade-based samples as described in the separate "Defining Variance Strata and Forming Replicates" links above. In the next step, a random subset of schools in each replicate
stratum was excluded. The remaining subset and all schools in the other replicate strata then constituted one of the 62 replicates.
Defining Variance Strata and Forming Replicates (age-based samples)
Defining Variance Strata and Forming Replicates (grade-based samples)
Replicate Variance Estimation
For the 2022 LTT assessments, the same PSUs were sampled in 2022 and 2020. In fact, any comparison of the 2022 and 2020 estimates is a comparison of the same schools, so each school must be in the same variance stratum and variance unit in the two years so that the jackknife variance estimation will correctly reflect this dependence. To ensure that standard errors for trend would be calculated appropriately, each noncertainty PSU was assigned the same variance stratum and variance unit as in 2020. Likewise,
in certainty PSUs, schools that were retained in 2022 from the 2020 sample were assigned the same variance stratum and variance unit as in 2020.
A replicate weight was calculated for each of the 62 replicates using weighting procedures similar to those used for the full-sample weight. Each replicate base weight contains an additional component, known as a replicate factor, to account for the subsetting of the sample to form the replicate. By repeating the various weighting procedures on each set of replicate base weights, the impact of these procedures on the sampling variance of an estimate is appropriately reflected in the variance estimate.
Each of the 62 replicate weights for school s in stratum j can be expressed as follows:
\begin{equation} \begin{aligned} SCH\_WGT_{js}(r)= {} & SCH\_BWT_{js}(r) \times SCH\_NRAF_{js}(r) \times\\ &SCH\_TRIM_{js} \times SCHSESWT_{js} \times SCH\_SUBJ\_AF_{js} \end{aligned} \end{equation}
where
 \(SCH\_BWT_{js}(r)\)
is the
replicate school
base weight
for replicate
\(r\);
\(SCH\_BWT_{js}(r)\)
is the
replicate school
base weight
for replicate
\(r\);
\(SCH\_NRAF_{js}(r)\)
is the
school-level nonresponse
adjustment factor
for replicate
\(r\);
 \(SCH\_TRIM_{js}\)
is the
school-level weight
trimming adjustment
factor;
\(SCH\_TRIM_{js}\)
is the
school-level weight
trimming adjustment
factor;
 \(SCHSESWT_{js}\)
is the
school-level session
assignment weight;
and
\(SCHSESWT_{js}\)
is the
school-level session
assignment weight;
and
![]() \(SCH\_SUBJ\_AF_{js}\) is the small-school subject adjustment
factor.
\(SCH\_SUBJ\_AF_{js}\) is the small-school subject adjustment
factor.
Specific school nonresponse adjustment factors were calculated separately for each replicate, as indicated by the index (r) in the formula, and applied to the replicate school base weights. Computing separate nonresponse adjustment factors for each replicate allows resulting variances from the use of the final school replicate weights to reflect components of variance due to this weight adjustment.
School weight trimming adjustments were not replicated, that is, not calculated separately for each replicate. Instead, each replicate used the school trimming adjustment factors derived for the full sample. Statistical theory for replicating trimming adjustments under the jackknife approach has not been developed in the literature. Due to the absence of a statistical framework, and since relatively few school weights in NAEP require trimming, the weight trimming adjustments were not replicated.
In addition, the school-level session assignment weight and the small-school subject adjustment factor also used the same factors derived for the full sample.
NAEP Technical Documentation Computation of Replicate Student Weights for Variance Estimation
In addition to the full-sample weight, a set of 62 replicate weights was provided for each student. These replicate weights are used in calculating the sampling variance of estimates obtained from the data, using the jackknife repeated replication method. The method of deriving these weights was aimed at reflecting the features of the sample design appropriately for each sample, so that when the jackknife variance estimation procedure is implemented, approximately unbiased estimates of sampling variance are obtained. This section gives the specifics for generating the replicate weights for the 2022 assessment samples.
The theory that underlies the jackknife variance estimators used in NAEP studies is discussed in the section Replicate Variance Estimation.
In general, the process of creating jackknife replicate weights takes place at both the school and student level. The precise implementation differs between those samples that involve the selection of Primary Sampling Units (PSUs) and those where the school is the first stage of sampling. The procedure for this second kind of sample also differed starting in 2011 from all
Defining Variance Strata and Forming Replicates
Computing School-Level Replicate Factors
Computing Student-Level Replicate Factors
Replicate Variance Estimation
previous NAEP assessments. The change that was implemented permitted the introduction of a finite population correction factor at the school sampling stage, developed by Rizzo and Rust (2011). In assessments prior to 2011, this adjustment factor has always been implicitly assumed equal to 1.0, resulting in some overestimation of the sampling variance.
PSU-Based (i.e., Age-Based) Samples
For the 2022 long-term trend (LTT) samples, which involve the selection of PSUs, the process for computing replicate student weights for variance estimation is very similar to the one that was used in 2020. The same PSUs were sampled in 2022 and 2020. In fact, any comparison of the 2022 and 2020 estimates is a comparison of the same schools, so each school must be in the same variance stratum and variance unit in the two years so that the jackknife variance estimation will correctly reflect this dependence. To ensure that standard errors for trend would be calculated appropriately, each noncertainty PSU was assigned the same variance stratum and variance unit as in 2020. Likewise, in certainty PSUs, schools that were retained in 2022 from the 2020 sample were assigned the same variance stratum and variance unit as in 2020. For more information about computing replicate student weights for the LTT samples see here.
Grade-Based Samples
The process for computing replicate student weights for variance estimation for the 2022 grade-based samples is as follows:
For each sample, the calculation of replicate weighting factors at the school level was conducted in a series of steps. First, each school was assigned to one of 62 variance estimation strata. Then, a random subset of schools in each variance estimation stratum was assigned a replicate factor of between 0 and 1. Next, the remaining subset of schools in the same variance stratum was assigned a complementary replicate factor greater than 1. All schools in the other variance estimation strata were assigned a replicate factor of exactly 1. This process was repeated for each of the 62 variance estimation strata so that 62 distinct replicate factors were assigned to each school in the sample.
This process was then repeated at the student level. Here, each individual sampled student was assigned to one of 62 variance estimation strata, and 62 replicate factors with values either between 0 and 1, greater than 1, or exactly equal to 1 were assigned to each student.
For example, consider a single hypothetical student. For replicate 37, that student’s student replicate factor might be 0.8, while for the school to which the student belongs, for replicate 37, the school replicate factor might be 1.6. Of course, for a given student, for most replicates, either the student replicate factor, the school replicate factor, or (usually) both, is equal to 1.0.
A replicate weight was calculated for each student, for each of the 62 replicates, using weighting procedures similar to those used for the full-sample weight. Each replicate weight contains the school and student replicate factors described above. By repeating the various weighting procedures on each set of replicates, the impact of these procedures on the sampling variance of an estimate is appropriately reflected in the variance estimate.
Each of the 62 replicate weights for student \(k\) in school \(s\) in stratum \(j\) can be expressed as
\begin{equation} \begin{aligned} FSTUWGT_{jsk}(r) = {} & STU\_BWT_{jks} \times SCH\_REPFAC_{js}(r) \times SCH\_NRAF_{js}(r) \times \\ & STU\_REPFAC_{jsk}(r) \times STU\_NRAF_{jsk}(r) \times \\ & SCH\_TRIM_{js} \times STU\_TRIM_{jsk} \times STU\_RAKE_{jsk}(r) \end{aligned}, \end{equation} where
\(STU\_BWT_{jks}\)
is the
student base
weight;
 \(SCH\_REPFAC_{js}(r)\)
is the
school-level replicate
factor for
replicate \(r\);
\(SCH\_REPFAC_{js}(r)\)
is the
school-level replicate
factor for
replicate \(r\);
\(SCH\_NRAF_{js}(r)\)
is the
school-level nonresponse
adjustment factor
for replicate
\(r\);
\(STU\_REPFAC_{jsk}(r)\)
is the
student-level replicate
factor for
replicate \(r\);
 \(STU\_NRAF_{jsk}(r)\)
is the
student-level nonresponse
adjustment factor
for replicate
\(r\);
\(STU\_NRAF_{jsk}(r)\)
is the
student-level nonresponse
adjustment factor
for replicate
\(r\);
\(SCH\_TRIM_{js}\)
is the
school-level weight
trimming adjustment
factor;
\(STU\_TRIM_{jsk}\)
is the
student-level weight
trimming adjustment
factor; and
 \(STU\_RAKE_{jsk}(r)\)
is the
student-level raking
adjustment factor
for replicate
\(r\).
\(STU\_RAKE_{jsk}(r)\)
is the
student-level raking
adjustment factor
for replicate
\(r\).
Specific school and student nonresponse and student-level raking adjustment factors were calculated separately for each replicate, as indicated by the index \(r\) in the formula, and applied to the replicate student base weights. Computing separate nonresponse and raking adjustment factors for each replicate allows resulting variances from the use of the final student replicate weights to reflect components of variance due to these various weight adjustments.
School and student weight trimming adjustments were not replicated, that is, not calculated separately for each replicate. Instead, each replicate used the school and student trimming adjustment factors derived for the full sample. Statistical theory for replicating trimming adjustments under the jackknife approach has not been developed in the literature. Due to the absence of a statistical framework, and since relatively few school and student weights in NAEP require trimming, the weight trimming adjustments were not replicated.
NAEP Technical Documentation Computing School-Level Replicate Factors
The school-level replication procedures differed for the age-based samples and the grade-based samples because the latter incorporate finite population corrections.
Age-Based Samples
For the NAEP 2022 age-based long-term trend (LTT) assessments, the school-level replication was carried out using the same procedures used for 2020 LTT. Those procedures are described here.
Grade-Based Samples
The replicate variance estimation approach for the grade-based civics, mathematics, reading, and U.S. history assessments involved finite population corrections at the school level. The calculation of school-level replicate factors for these assessments depended upon whether or not a school was selected with certainty. For certainty schools, the school-level replicate factors for all replicates are set to unity–this is true regardless of whether or not the variance replication method uses finite population corrections–since certainty schools are not subject to sampling variability. Alternatively, one can view the finite population correction factor for such schools as being equal to zero. Thus, for each certainty school in a given assessment, the school-level replicate factor for each of the 62 replicates (\(r=1, ..., 62\)) was assigned as
\begin{equation} SCH\_REPFAC_{js}(r)=1 , \displaystyle \end{equation}
where \(SCH\_REPFAC_{js}(r)\) is the school-level replicate factor for school \(s\) in primary stratum \(j\) for the \(r\)-th replicate.
For noncertainty schools, where preliminary variance strata were formed by grouping schools into pairs or triplets, school-level replicate factors were calculated for each of the 62 replicates based on this grouping. For schools in variance strata comprising pairs of schools, the school-level replicate factors, \(SCH\_REPFAC_{js}(r) = 1,..., 62\), were calculated as
\begin{equation} SCH\_REPFAC_{js}(r) = \left\{\begin{array}{llll} 1 + \sqrt{(1-min(\pi_{j1}, \pi_{j2}))}, & \text{for } js \in R_{jr}, U_{js} = 1 \\ 1 - \sqrt{(1-min(\pi_{j1},
\pi_{j2}))}, & \text{for } js \in R_{jr}, U_{js} = 2 \\ 1, & \text{for } js \notin R_{jr} \end{array}\right. , \end{equation}
where
\(min(\pi_{j1}, \pi_{j2})\) is the smallest school probability between the two schools comprising \(R_{jr}\);
\(R_{jr}\) is the set of schools within the \(r\)-th variance stratum for primary stratum \(j\); and
\(U_{js}\) is the variance unit (1 or 2) for school \(s\) in primary stratum \(j\).
For triples (i.e., variance strata comprising 3 schools), the replicate factors are perturbed to something other than 1.0 for two different variance strata, rather than just for one stratum as in the case of pairs (i.e., variance strata comprising 2 schools). The replicate factors are perturbed in variance stratum \(r\) and variance stratum \(r'\), where \(r'\) is furthest away from variance stratum \(r\) in either direction (i.e., before or after stratum \(r\)). Because there are 62 replicates, the stratum furthest away from stratum \(r\) would be the stratum whose number is the number of stratum \(r\) plus or minus half of 62, depending on whether \(r\) is greater or less than 31. In other words, \(r'=r+31\) \ (mod\) \(62\). For example, if variance stratum 40 has three schools, replicate factors are perturbed in variance stratum 40 (\(r\)) and variance stratum 9 (\(r'\)). The school-level replicate factors \(SCH\_REPFAC_{js}(r)\), \(r = 1,..., 62\), were calculated as follows:
For school \(s\) from primary stratum \(j\) variance stratum \(r\),
\begin{equation} SCH\_REPFAC_{js}(r) = \left\{\begin{array}{llll} 1 + \dfrac {\sqrt{(1-min(\pi_{j1}, \pi_{j2}, \pi_{j3}))}} {2}, & \text{for } js \in R_{jr}, U_{js} = 1 \\ 1 +
\dfrac {\sqrt{(1-min(\pi_{j1}, \pi_{j2}, \pi_{j3}))}} {2}, & \text{for } js \in R_{jr}, U_{js} = 2 \\ 1 - \sqrt{(1-min(\pi_{j1}, \pi_{j2}, \pi_{j3}))}, & \text{for } js \in R_{jr}, U_{js} = 3 \end{array}\right. , \end{equation}
while for variance stratum \(r'\),
\begin{equation} SCH\_REPFAC_{js}(r’) = \left\{\begin{array}{llll} 1 + \dfrac {\sqrt{(1-min(\pi_{j1}, \pi_{j2}, \pi_{j3}))}} {2}, & \text{for } js \in R_{jr}, U_{js} = 1 \\ 1 -
\sqrt{(1-min(\pi_{j1}, \pi_{j2}, \pi_{j3}))}, & \text{for } js \in R_{jr}, U_{js} = 2 \\ 1 + \dfrac {\sqrt{(1-min(\pi_{j1}, \pi_{j2}, \pi_{j3}))}} {2}, & \text{for } js \in R_{jr}, U_{js} = 3 \\ \end{array}\right. , \end{equation}
and for all other variance strata, further called \(r\) with an asterisk (\(r^*\)) (that is, strata other than variance strata \(r\) and \(r'\)),
\begin{equation} SCH\_REPFAC_{js}(r^*) = 1 , \end{equation} where
![]() \(min(\pi_{j1},
\pi_{j2}, \pi_{j3})\)
is the
smallest school
probability among
the three
schools comprising
\(R_{jr}\);
\(min(\pi_{j1},
\pi_{j2}, \pi_{j3})\)
is the
smallest school
probability among
the three
schools comprising
\(R_{jr}\);
![]() \(R_{jr}\) is the set of schools within the \(r\)-th variance
stratum for primary stratum \(r\); and
\(R_{jr}\) is the set of schools within the \(r\)-th variance
stratum for primary stratum \(r\); and
![]() \(U_{js}\) is the variance unit (1, 2, or 3) for school \(s\)
in primary stratum \(j\).
\(U_{js}\) is the variance unit (1, 2, or 3) for school \(s\)
in primary stratum \(j\).
In primary strata with fewer than 62 variance strata, the replicate weights for the “unused” variance strata (the remaining ones up to 62) for these schools were set equal to the school base weight (so that those replicates contribute nothing to the variance estimate).
NAEP Technical Documentation Computing Student-Level Replicate Factors
The student-level replication procedures differed for the age-based samples and the grade-based samples because the latter incorporate finite population corrections.
Age-Based Samples
For the NAEP 2022 age-based long-term trend (LTT) assessments, the student-level replication was carried out using the same procedures used for 2020 LTT. Those procedures are described here.
Grade-Based Samples
For the grade-based civics, mathematics, reading, and U.S. history assessment samples, which involved school-level finite population corrections, the student-level replication factors were calculated the same way regardless of whether or not the student was in a certainty school.
For students in student-level variance strata comprising pairs of students, the student-level replicate factors, \(STU\_REPFAC_{jsk}(r)\), \(r = 1,..., 62\), were calculated as
\begin{equation} STU\_REPFAC_{jsk}(r) = \left\{\begin{array}{llll} 1 + \sqrt {\pi_{s}}, & \text{for } jsk \in R_{jsr}, U_{jsk} = 1 \\ 1 - \sqrt {\pi_{s}}, & \text{for } jsk \in R_{jsr}, U_{jsk} = 2 \\ 1, & \text{for } jsk \notin R_{jsr} \end{array}\right. , \end{equation}
where
![]() \(\pi_{s}\) is the probability of selection for school \(s\);
\(\pi_{s}\) is the probability of selection for school \(s\);
![]() \(R_{jsr}\) is
the set
of students
within the
\(r\)-th variance
stratum for
school \(s\)
in primary
stratum \(j\);
and
\(R_{jsr}\) is
the set
of students
within the
\(r\)-th variance
stratum for
school \(s\)
in primary
stratum \(j\);
and
![]() \(U_{jsk}\) is the variance unit (1 or 2) for student \(k\) in
school \(s\) in stratum \(j\).
\(U_{jsk}\) is the variance unit (1 or 2) for student \(k\) in
school \(s\) in stratum \(j\).
For triples (i.e., variance strata comprising three students), the replicate factors are perturbed to something other than 1.0 for two different variance strata, rather than just for one stratum as in the case of pairs (i.e., variance strata comprising 2 students). The replicate factors are perturbed in variance stratum \(r\) and variance stratum \(r'\), where \(r'\) is furthest away from variance stratum \(r\) in either direction (i.e., before or after stratum \(r\)). Because there are 62 replicates, the stratum furthest away from stratum \(r\) would be the stratum whose number is the number of stratum \(r\) plus or minus half of 62, depending on whether \(r\) is greater or less than 31. In other words, \(r'=r+31\) \ (mod\) \(62\). For example, if variance stratum 1 has three students, replicate factors are perturbed in variance stratum 1 (\(r\)) and variance stratum 32 (\(r'\)). The student-level replicate factors \(STU\_REPFAC_{jsk}(r)\), \(r = 1,..., 62\), were calculated as follows:
\begin{equation} STU\_REPFAC_{jsk}(r) = \left\{\begin{array}{llll} 1 + \dfrac {\sqrt {\pi_{s}}} {2}, & \text{for } jsk \in R_{jsr}, U_{jsk} = 1 \\ 1 + \dfrac {\sqrt {\pi_{s}}}
{2}, & \text{for } jsk \in R_{jsr}, U_{jsk} = 2 \\ 1 - \sqrt {\pi_{s}}, & \text{for } jsk \in R_{jsr}, U_{jsk} = 3 \end{array}\right. , \end{equation} while for variance stratum \(r' = r + 31\) \(mod\) \(62\),
\begin{equation} STU\_REPFAC_{jsk}(r') = \left\{\begin{array}{llll} 1 + \dfrac {\sqrt {\pi_{s}}} {2}, & \text{for } jsk \in R_{jsr}, U_{jsk} = 1 \\ 1 - \sqrt {\pi_{s}}, &
\text{for } jsk \in R_{jsr}, U_{jsk} = 2 \\ 1 + \dfrac {\sqrt {\pi_{s}}} {2}, & \text{for } jsk \in R_{jsr}, U_{jsk} = 3 \end{array}\right. , \end{equation} and for all other variance strata, further called \(r\) with an asterisk (\(r^*\)), (that is, variance strata other than strata \(r\) and \(r'\)),
\begin{equation} STU\_REPFAC_{jsk}(r^*) = 1 , \end{equation} where
\(\pi_{s}\)
is the
probability of
selection for
school \(s\);
![]() \(R_{jsr}\) is
the set
of students
within the
\(r\)-th replicate
stratum for
school \(s\)
in stratum
\(j\); and
\(R_{jsr}\) is
the set
of students
within the
\(r\)-th replicate
stratum for
school \(s\)
in stratum
\(j\); and
![]() \(U_{jsk}\) is the variance unit (1, 2, or 3) for student
\(k\) in school \(s\) in stratum \(j\).
\(U_{jsk}\) is the variance unit (1, 2, or 3) for student
\(k\) in school \(s\) in stratum \(j\).
Note, for students in certainty schools, where \(\pi_{s}=1\), the student replicate factors are 2 and 0 in the case of pairs, and 1.5, 1.5, and 0 in the case of triples.
NAEP Technical Documentation Defining Variance Strata and Forming Replicates
For NAEP 2022, the procedure used to define variance strata and form replicates differed for the age-based samples and the grade-based samples.
Age-Based Samples
In the NAEP 2022 age-based assessments for long-term trend (LTT), the procedure used to define variance strata and form replicates was the same one used for the 2020 LTT assessments. That procedure is described here .
Grade-Based Samples
In the NAEP 2022 grade-based assessments, replicates were formed separately for each sample indicated by grade (4 or 8), school type (public or private), and assessment subject (civics, mathematics, reading, and U.S. history). To reflect the school-level finite population corrections in the variance estimators for these two-stage samples, replication was carried out at both the school and student levels.
The first step in forming replicates was to create preliminary variance strata in each primary stratum. This was done by sorting the appropriate sampling unit (school or student) in the order of its selection within the primary stratum and then pair off adjacent sampling units into preliminary variance strata. Sorting sample units by their order of sample selection reflects the implicit stratification and systematic sampling features of the sample design. Within each primary stratum with an even number of sampling units, all of the preliminary variance strata consisted of pairs of sampling units. However, within primary strata with an odd number of sampling units, all but one variance strata consisted of pairs of sampling units, while the last one consisted of three sampling units.
The next step is to form the final variance strata by combining preliminary strata if appropriate. If there were more than 62 preliminary variance strata within a primary stratum, the preliminary variance strata were grouped to form 62 final variance strata. This grouping effectively maximized the distance in the sort order between grouped preliminary variance strata. The first 62 preliminary variance strata, for example, were assigned to 62 different final variance strata in order (1 through 62), with the next 62 preliminary variance strata assigned to final variance strata 1 through 62, so that, for example, preliminary variance stratum 1, preliminary variance stratum 63, preliminary variance stratum 125 (if in fact there were that many), etc., were all assigned to the first final variance stratum.
If, on the other hand, there were fewer than 62 preliminary variance strata within a primary stratum, then the number of final variance strata was set equal to the number of preliminary variance strata. For example, consider a primary stratum with 111 sampled units sorted in their order of selection. The first two units were in the first preliminary variance stratum; the next two units were in the second preliminary variance stratum, and so on, resulting in 54 preliminary variance strata with two sample units each (doublets). The last three sample units were in the 55th preliminary variance stratum (triplet). Since there are no more than 62 preliminary variance strata, these were also the final variance strata.
Within each preliminary variance stratum containing a pair of sampling units, one sampling unit was randomly assigned as the first variance unit and the other as the second variance unit. Within each preliminary variance stratum containing three sampling units, the three first-stage units were randomly assigned variance units 1 through 3.
Mathematics and Reading Assessments (Grades 4 and 8)
At the school level for these samples, formation of preliminary variance strata did not pertain to certainty schools, since they are not subject to sampling variability, but only to noncertainty schools. The primary stratum for noncertainty schools was the highest school-level sampling stratum variable listed below, and the order of selection was defined by sort order on the school sampling frame.
![]() Trial Urban
District Assessment
(TUDA) districts,
remainder of
states (for
states with
TUDAs), or
entire states
for the
public school
samples at
grades 4
and 8;
and
Trial Urban
District Assessment
(TUDA) districts,
remainder of
states (for
states with
TUDAs), or
entire states
for the
public school
samples at
grades 4
and 8;
and
![]() Private school affiliation (Catholic, non-Catholic) for the
private school samples at grades 4 and 8.
Private school affiliation (Catholic, non-Catholic) for the
private school samples at grades 4 and 8.
At the student level, all students were assigned to variance strata. The primary stratum was school, and the order of selection was defined by session number and position on the administration schedule.
Within each pair of preliminary variance strata, one first-stage unit, designated at random, was assigned as the first variance unit and the other first-stage unit as the second variance unit. Within each triplet preliminary variance stratum, the three schools were randomly assigned variance units 1 through 3.
Civics and U.S. History Assessments (Grade 8)
At the school level for these samples, formation of preliminary variance strata did not pertain to certainty schools, since they are not subject to sampling variability, but only to noncertainty schools. The primary stratum for noncertainty schools was the highest school-level sampling stratum variable listed below, and the order of selection was defined by sort order on the school sampling frame.
![]() The nation
(50 states
and the
District of
Columbia) for
the public
school samples
at grade
8; and
The nation
(50 states
and the
District of
Columbia) for
the public
school samples
at grade
8; and
![]() Private school affiliation (Catholic, non-Catholic) for the
private school samples at grade 8.
Private school affiliation (Catholic, non-Catholic) for the
private school samples at grade 8.
At the student level, all students were assigned to variance strata. The primary stratum was school, and the order of selection was defined by session number and position on the administration schedule.
Within each pair of preliminary variance strata, one first-stage unit, designated at random, was assigned as the first variance unit and the other first-stage unit as the second variance unit. Within each triplet preliminary variance stratum, the three schools were randomly assigned variance units 1 through 3.
NAEP Technical Documentation Replicate Variance Estimation
Variances for NAEP assessment estimates are computed using the paired jackknife replicate variance procedure. This technique is applicable for common statistics, such as means and ratios, and differences between these for different subgroups, as well as for more complex statistics such as linear or logistic regression coefficients.
In general, the paired jackknife replicate variance procedure involves initially pairing clusters of first-stage sampling units to form \(H\) variance strata \(h = 1, 2, 3, ..., H\) with two units per stratum. The first replicate is formed by assigning, to one unit at random from the first variance stratum, a replicate weighting factor of less than 1.0, while
assigning the remaining unit a complementary replicate factor greater than 1.0, and assigning all other units from the other \(H - 1\) strata a replicate factor of 1.0. This procedure is carried out for each variance stratum resulting in \(H\) replicates, each of which provides an estimate of the population total.
In general, this process is repeated for subsequent levels of sampling. In practice, this is not practicable for a design with three or more stages of sampling, and the marginal improvement in precision of the variance estimates would be negligible in all such cases in the NAEP setting. Thus in NAEP, when a two-stage design is used–sampling schools and then students–beginning in 2011 replication is carried out at both stages for the purpose of computing replicate student weights. The change implemented in 2011 permitted the introduction of a finite population correction factor at the school sampling stage. Prior to 2011, replication was only carried out at the first stage of selection. See Rizzo and Rust (2011) for a description of the methodology.
When a three-stage design is used, involving the selection of geographic Primary Sampling Units (PSUs), then schools, and then students, the replication procedure is only carried out at the first stage of sampling (the PSU stage for noncertainty PSUs, and the school stage within certainty PSUs). In this situation, the school and student variance components are correctly estimated, and the overstatement of the between-PSU variance component is relatively very small.
The jackknife estimate of the variance for any given statistic is given by the following formula:
\begin{equation} \nu(\hat{t}) =\sum_{h=1}^{H} {(\hat{t}_{h}-\hat{t})^2}, \end{equation} where
![]() \(\hat{t}\) represents
the full
sample estimate
of the
given statistic;
and
\(\hat{t}\) represents
the full
sample estimate
of the
given statistic;
and
![]() \(\hat{t}_{h}\)
represents the
corresponding estimate
for replicate
\(h\).
\(\hat{t}_{h}\)
represents the
corresponding estimate
for replicate
\(h\).
Each replicate undergoes the same weighting procedure as the full sample so that the jackknife variance estimator reflects the contributions to or reductions in variance resulting from the various weighting adjustments.
The NAEP jackknife variance estimator is based on 62 variance strata resulting in a set of 62 replicate weights assigned to each school and student.
The basic idea of the paired jackknife variance estimator is to create the replicate weights so that use of the jackknife procedure results in an unbiased variance estimator for totals and means, which is also reasonably efficient (i.e., has a low variance as a variance estimator). The jackknife variance estimator will then produce a consistent (but not fully unbiased) estimate of variance for (sufficiently smooth) nonlinear functions of total and mean estimates such as ratios, regression coefficients, and so forth (Shao and Tu 1995).
The development below shows why the NAEP jackknife variance estimator returns an unbiased variance estimator for totals and means, which is the cornerstone to the asymptotic results for nonlinear estimators. See for example Rust (1985). This paper also discusses why this variance estimator is generally efficient (i.e., more reliable than alternative approaches requiring similar computational resources).
The development is done for an estimate of a mean based on a simplified sample design that closely approximates the sample design for first-stage units used in the NAEP studies. The sample design is a stratified random sample with \(H\) strata with population weights \(W_{h}\), stratum sample sizes \(n_{h}\), and stratum sample means \ (\overline{y}_{h}\). The population estimator \(\hat{\overline{Y}}\) and the standard unbiased variance estimator \(\nu(\hat{\overline{Y}})\) are
\begin{equation} \hat{\overline{Y}} =\sum_{h=1}^{H} W_{h}\overline{y}_{h}, \end{equation}
\begin{equation} \nu \left(\hat{\overline{Y}} \right) = \sum_{h=1}^{H} W_{h}^2 \frac{s_h^2}{n_{h}}, \end{equation}
with
\begin{equation} s^2_h=\frac{1}{n_{h}-1} \sum_{i=1}^{n_{h}} {(y_{h_{i}}-\overline{y}_{h})^2}. \end{equation}
The paired jackknife replicate variance estimator assigns one replicate \(h=1,…,H\) to each stratum, so that the number of replicates equals \(H\). In NAEP, the replicates correspond generally to pairs and triplets (with the latter only being used if there are an odd number of sample units within a particular primary stratum generating replicate strata). For pairs, the process of generating replicates can be viewed as taking a simple random sample \(J\) of size \(\frac{n_{h}}{2}\) within the replicate stratum, and assigning an increased weight to the sampled elements, and a decreased weight to the unsampled elements. In certain applications, the increased weight is double the full sample weight, while the decreased weight is in fact equal to zero. In this simplified case, this assignment reduces to replacing \(\overline{y}_{h}\) with \(\overline{y}_{h} (J)\), the latter being the sample mean of the sampled \(\frac{n_{h}}{2}\) units. Then the replicate estimator corresponding to stratum \(r\) is
\begin{equation} \hat{\overline{Y}}(r)=\sum_{h \ne r}^{H} W_{h} \overline{y}_h + W_r \overline{y}_h(J). \end{equation} The \(r\)-th term in the sum of squares for \(\nu_{j} \left( \hat{\overline{Y}}\right)\) is thus
\begin{equation} \left( \hat{\overline{Y}}(r)- \hat{\overline{Y}} \right)^2 = W_r^2 \left( \overline{y}_r(J)- \overline{y}_r \right)^2. \end{equation}
In stratified random sampling, when a sample of size \(\frac{n_r}{2}\) is drawn without replacement from a population of size \(n_r\), the sampling variance is
\begin{equation} \begin{aligned} E \left( \overline{y}_{r’}(J)-\overline{y}_r \right)^2 = \frac {1} {\frac{n_r}{2} } \frac{ n_r - \frac{n_r}{2}} {n_r} \frac {1}{n_r-1}
\sum_{i=1}^{n_r} \left( y_{r_{i}} - \overline{y}_r \right)^2 \\ = \frac {1} {n_r \left( n_r-1 \right) } \sum_{i=1}^{n_r} \left( y_{r_{i}} - \overline{y}_r \right)^2 = \frac
{s^2_r}{n_r}. \end{aligned} \end{equation}
See for example Cochran (1977), Theorem 5.3, using \(n_r\), as the “population size,” \(\frac{n_r}{2}\)as the “sample size,” and \(s^2_r\) as the “population variance” in the given formula. Thus,
\begin{equation} E \left\{ W_r^2 \left( \overline{y}_{r}(J)- \overline{y}_r \right)^2 \right\} = W_r^2 \frac{s_r^2}{n_r}. \end{equation} Taking the expectation over all of these stratified samples of size \(\frac{n_r}{2}\), it is found that
\begin{equation} E \left( \nu_j \left( \hat{\overline{Y}} \right) \right) =\nu \left( \hat{\overline{Y}}\right). \end{equation}
In this sense, the jackknife variance estimator "gives back" the sample variance estimator for means and totals as desired under the theory.
In cases where, rather than doubling the weight of one half of one variance stratum and assigning a zero weight to the other, the weight of one unit is multiplied by a replicate factor of \((1+\delta)\), while the other is multiplied by \((1-\delta)\), the result is that
\begin{equation} E \left( \hat{\overline{y}}(r)- \hat{\overline{y}} \right)^2 = W^2_r \delta^2 \frac{s^2_r}{n_r}. \end{equation}
In this way, by setting \(\delta\) equal to the square root of the finite population correction factor, the jackknife variance estimator is able to incorporate a finite population correction factor into the variance estimator.
In practice, variance strata are also grouped to make sure that the number of replicates is not too large (the total number of variance strata is usually 62 for NAEP). The randomization from the original sample distribution guarantees that the sum of squares contributed by each replicate will be close to the target expected value.
For triples, the replicate factors are perturbed to something other than 1.0 for two different replicate factors, rather than just one as in the case of pairs. Again in the simple case where replicate factors that are less than 1 are all set to 0, the replicate weight factors are calculated as follows.
For unit \(i\) in variance stratum \(r\)
\begin{equation} w_i(r) = \left\{\begin{array}{lll} 1.5w_i & i= \text{variance unit 1}\\ 1.5w_i & i= \text{variance unit 2}\\ 0 & i= \text{variance unit 3} \end{array}\right.
\end{equation}
where weight \(w_i\) is the full sample base weight. Furthermore, for \(r'=r+31\) \(mod\) \(62\)
\begin{equation} w_i(r') = \left\{ \begin{array}{llll} 1.5w_i & i= \text{variance unit 1}\\ 0 & i= \text{variance unit 2}\\ 1.5w_i & i= \text{variance unit 3} \end{array}\right.
\end{equation}
And for all other values \(r^*\), other than \(r\) and \(r'\), \(w_i \left(r^*\right)=1\).
In the case of stratified random sampling, this formula reduces to replacing \(\overline{y}_r\) with \(\overline{y}_r(J)\) for replicate \(r\), where \(\overline{y}_r(J)\) is the sample mean from a "\(2/3\)" sample of \(\frac{2n_r}{3}\) units from the \(n_r\) sample units in the replicate stratum, and replacing \(\overline{y}_r\) with \(\overline{y}_{r'} (J)\) for replicate \(r'\), where \(\overline{y}_{r'}(J)\) is the sample mean from another overlapping "\(2/3\)" sample of \(\frac{2n_r}{3}\) units from the \(n_r\) sample units in the replicate stratum.
The \(r\)-th and \(r'\)-th replicates can be written as
\begin{equation} \hat{\overline{Y}}(r)=\sum_{h \ne r}^{H} W_{h} \overline{y}_h + W_r \overline{y}_r(J), \end{equation}
\begin{equation} \hat{\overline{Y}}(r')=\sum_{h \ne r}^{H} W_{h} \overline{y}_h + W_r \overline{y}_{r'}(J). \end{equation}
From these formulas, expressions for the \(r\)-th and \(r'\)-th components of the jackknife variance estimator are obtained (ignoring other sums of squares from other grouped components attached to those replicates):
\begin{equation} \left( \hat{\overline{Y}}(r)- \hat{\overline{Y}}\right)^2= W^2_r \left( \overline{y}_r(J)- \overline{y}_{r}\right)^2, \end{equation}
\begin{equation} \left( \hat{\overline{Y}}(r’)- \hat{\overline{Y}}\right)^2= W^2_r \left( \overline{y}_{r’}(J)- \overline{y}_{r}\right)^2. \end{equation} These sums of squares have expectations as follows, using the general formula for sampling variances:
\begin{equation} \begin{aligned} E\left( \overline{y}_r(J)- \overline{Y}_r\right)^2= \frac {1}{\frac{2n_r}{3}} \frac {n_r- \frac{2n_r}{3} }{n_r} \frac {1}{n_r-1}
\sum_{i=1}^{n_r} \left( y_{r_{i}} - \overline{y}_r \right)^2 \\ =\frac{1}{2n_r \left( n_r-1\right)} \sum_{i=1}^{n_r} \left( y_{r_{i}} - \overline{y}_r \right)^2 \\ =\frac
{s^2_r}{2n_r}, \end{aligned} \end{equation}
\begin{equation} \begin{aligned} E\left( \overline{y}_{r’}(J)- \overline{Y}_r\right)^2= \frac {1}{\frac{2n_r}{3}} \frac {n_r- \frac{2n_r}{3} }{n_r} \frac {1}{n_r-1}
\sum_{i=1}^{n_r} \left( y_{r_{i}} - \overline{y}_r \right)^2 \\ =\frac{1}{2n_r \left( n_r-1\right)} \sum_{i=1}^{n_r} \left( y_{r_{i}} - \overline{y}_r \right)^2 \\ =\frac
{s^2_r}{2n_r}. \end{aligned} \end{equation} Thus,
\begin{equation} \begin{aligned} E \left\{ W_r^2 \left( \overline{y}_r(J)- \overline{y}_r \right)^2 + W_r^2 \left( \overline{y}_{r’}(J)- \overline{y}_r \right)^2 \right\} \\ = W_r^2 \left( \frac {s^2_r}{2n_r} + \frac {s^2_r}{2n_r} \right) \\ = W_r^2 \frac {s^2_r}{n_r}, \end{aligned} \end{equation}
as desired again.

NAEP Technical Documentation Quality Control on Weighting Procedures
Given the complexity of the weighting procedures utilized in NAEP, a range of quality control (QC) checks was conducted throughout the weighting process to identify potential problems with collected student-level demographic data or with specific weighting procedures. The QC processes included:
![]() checks performed within each step of the weighting process;
checks performed within each step of the weighting process;
![]() checks performed
across adjacent
steps of
the weighting
process;
checks performed
across adjacent
steps of
the weighting
process;
![]() review of participation, exclusion, and accommodation rates;
review of participation, exclusion, and accommodation rates;
![]() checks of demographic data of individual schools and
students;
checks of demographic data of individual schools and
students;
![]() comparisons with
2019 demographic
data (or
2020 demographic
data in
the case
of long-term
trend [LTT]);
and
comparisons with
2019 demographic
data (or
2020 demographic
data in
the case
of long-term
trend [LTT]);
and
![]() nonresponse bias analyses.
nonresponse bias analyses.
Final Participation, Exclusion, and Accommodation Rates
Nonresponse Bias Analyses
To validate the weighting process, extensive tabulations of various school and student characteristics at different stages of the process were conducted. The school-level characteristics included in the tabulations were racial/ethnic enrollment, median income (based on the school ZIP code area), and urban-centric locale. At the student level, the tabulations included race/ethnicity, gender, relative age, student disability (SD) status, English learner (EL) status, and participation status in National School Lunch Program (NSLP).
NAEP Technical Documentation Final Participation, Exclusion, and Accommodation Rates
Final participation, exclusion, and accommodation rates are presented in quality control tables for each grade (or age) and subject by geographic domain and school type. School- and student-level participation rates have been calculated according to National Center for Education Statistics (NCES) standards as they have been for previous assessments.
At the school level, private schools had participation rates below 85 percent in all grades (or ages) and subjects. At the student level, response rates at grade 8 fell below 85 percent for mathematics, reading, or both for the following state domains: Alaska, District of Columbia, Hawaii, New Hampshire, and New York; and the following TUDA domains: District of Columbia Public Schools, New
Grade 4 Mathematics
Grade 4 Reading
Grade 8 Mathematics
Grade 8 Reading
Grade 8 Civics Grade 8 U.S. History
York City, and Milwaukee. As required by NCES standards, nonresponse bias analyses were conducted on each reporting group falling below the 85 percent participation threshold.
Age 9 Mathematics
Age 9 Reading
Age 13 Mathematics
Age 13 Reading
NAEP Technical Documentation Participation, Exclusion, and Accommodation Rates for Age 13 Mathematics
The following table displays the school-level participation rates and student-level participation, exclusion, and accommodation rates for the age 13 long-term trend mathematics assessment. Various weights were used in the calculation of the school rates, as indicated in the column headings of the table. For the student participation rates, student base weights were used. For the student exclusion rates and accommodation rates, student base weights with adjustment for school nonresponse were used. Different weights were used at the student level because the student participation rates are conditional on (i.e., computed within) the participating schools, whereas the exclusion and accommodation rates are population estimates.
The school participation rates reflect the participation of the original sampled schools only and do not reflect any effect of substitution. The rates weighted by the school base weight and enrollment show the approximate proportion of the student population in the domain that is represented by the responding schools in the sample. The rates weighted by just the base weight show the proportion of the school population that is represented by the responding schools in the sample. These rates differ because schools differ in size.
Participation, exclusion, and accommodation rates, age 13 long-term trend mathematics assessment, by school type and geographic region: 2022
-
School type and geographic region
Number of schools in original sample, rounded
School participation rates (percent) before substitution (weighted by base
weight and enrollment)
School participation rates (percent) before substitution (weighted by base
weight only)
Number of students sampled, rounded
Weighted percent of students excluded
Weighted student participation rates (percent) after makeups
Weighted percent
of students accommodated
National all1
660
85.98
70.79
10,500
2.31
89.11
14.23
Northeast all
110
79.16
55.37
1,300
2.28
84.99
18.15
Midwest all
130
85.27
74.53
1,900
2.33
89.53
12.97
South all
260
87.71
72.78
4,500
1.79
90.17
16.62
West all
160
88.04
78.49
2,700
3.20
89.31
8.67
111 National all includes national public, national private, and Department of Defense Education Activity (DoDEA) schools that are located in the United States.
NOTE: School counts are rounded to nearest ten and student counts are rounded to nearest hundred. Detail may not sum to totals because of rounding.
SOURCE: U.S. Department of Education, Institute of Education Sciences, National Center for Education Statistics, National Assessment of Educational Progress (NAEP), 2022 Long-Term Trend Mathematics Assessment.
-
School participation
School
Number of
rates (percent)
participation rates
Weighted
schools in
before substitution
(percent) before
Number of
Weighted
student
original
(weighted by base
substitution
students
percent of
participation
Weighted percent
sample,
weight and
(weighted by base
sampled,
students
rates (percent)
of students
School type and geographic region rounded
enrollment)
weight only)
rounded
excluded
after makeups
accommodated
National public
480
89.81
91.10
9,700
2.48
89.25
15.08
National private
180
40.35
33.24
800
0.29
85.77
4.21
Catholic
60
82.98
80.17
700
0.73
85.77
6.34
Non-Catholic
120
12.54
17.27
100
0.00
85.76
2.83
111 National all includes national public, national private, and Department of Defense Education Activity (DoDEA) schools that are located in the United States. NOTE: School counts are rounded to nearest ten and student counts are rounded to nearest hundred. Detail may not sum to totals because of rounding.
SOURCE: U.S. Department of Education, Institute of Education Sciences, National Center for Education Statistics, National Assessment of Educational Progress (NAEP), 2022 Long-Term Trend Mathematics Assessment.
NAEP Technical Documentation Participation, Exclusion, and Accommodation Rates for Age 13 Reading
The following table displays the school-level participation rates and student-level participation, exclusion, and accommodation rates for the age 13 long-term trend reading assessment. Various weights were used in the calculation of the school rates, as indicated in the column headings of the table. For the student participation rates student base weights were used. For the student exclusion rates and accommodation rates, student base weights with adjustment for school nonresponse were used. Different weights were used at the student level because the student participation rates are conditional on (i.e., computed within) the participating schools, whereas the exclusion and accommodation rates are population estimates.
The school participation rates reflect the participation of the original sampled schools only and do not reflect any effect of substitution. The rates weighted by the school base weight and enrollment show the approximate proportion of the student population in the domain that is represented by the responding schools in the sample. The rates weighted by just the base weight show the proportion of the school population that is represented by the responding schools in the sample. These rates differ because schools differ in size.
Participation, exclusion, and accommodation rates, age 13 long-term trend reading assessment, by school type and geographic region: 2022
-
School type and geographic region
Number of schools in original sample, rounded
School participation rates (percent) before substitution (weighted by base
weight and enrollment)
School participation rates (percent) before substitution (weighted by base
weight only)
Number of students sampled, rounded
Weighted percent of students excluded
Weighted student participation rates (percent) after makeups
Weighted percent
of students accommodated
National all1
660
85.98
70.79
10,500
3.08
89.22
13.08
Northeast all
110
79.16
55.37
1,300
4.64
83.90
14.83
Midwest all
130
85.27
74.53
1,900
1.61
89.71
13.16
South all
260
87.71
72.78
4,600
2.85
91.05
15.39
West all
160
88.04
78.49
2,700
3.91
88.66
7.65
National public
480
89.81
91.10
9,700
3.29
89.28
13.53
National private
180
40.35
33.24
800
0.66
87.68
7.92
Catholic
60
82.98
80.17
700
0.42
87.16
4.50
Non-Catholic
120
12.54
17.27
100
0.83
89.97
10.18
1National all includes national public
, national priva
te, and Department of
Defense Education Ac
tivity (DoDEA)
schools that ar
e located in the Un
ited States.
NOTE: School counts are rounded to nearest ten and student counts are rounded to nearest hundred. Detail may not sum to totals because of rounding.
SOURCE: U.S. Department of Education, Institute of Education Sciences, National Center for Education Statistics, National Assessment of Educational Progress (NAEP), 2022 Long-Term Trend Reading Assessment.
NAEP Technical Documentation Participation, Exclusion, and Accommodation Rates for Age 9 Mathematics
The following table displays the school-level participation rates and student-level participation, exclusion, and accommodation rates for the age 9 long-term trend mathematics assessment. Various weights were used in the calculation of the school rates, as indicated in the column headings of the table. For the student participation rates, student base weights were used. For the student exclusion rates and accommodation rates, student base weights with adjustment for school nonresponse were used. Different weights were used at the student level because the student participation rates are conditional on (i.e., computed within) the participating schools, whereas the exclusion and accommodation rates are population estimates.
The school participation rates reflect the participation of the original sampled schools only and do not reflect any effect of substitution. The rates weighted by the school base weight and enrollment show the approximate proportion of the student population in the domain that is represented by the responding schools in the sample. The rates weighted by just the base weight show the proportion of the school population that is represented by the responding schools in the sample. These rates differ because schools differ in size.
Participation, exclusion, and accommodation rates, age 9 long-term trend mathematics assessment, by school type and geographic region: 2022
-
School type and geographic region
Number of schools in original sample, rounded
School participation rates (percent) before substitution (weighted by base
weight and enrollment)
School participation rates (percent) before substitution (weighted by base
weight only)
Number of students sampled, rounded
Weighted percent of students excluded
Weighted student participation rates (percent) after makeups
Weighted percent
of students accommodated
National all1
580
85.93
72.56
9,200
1.87
87.08
14.95
Northeast all
90
86.73
63.95
1,300
2.93
83.10
16.41
Midwest all
110
74.94
72.78
1,500
1.37
87.78
13.55
South all
240
93.22
79.44
4,300
1.59
88.44
19.57
West all
140
82.42
68.64
2,200
2.11
86.69
7.81
National public
410
90.45
88.79
8,700
2.02
86.96
16.00
National private
160
32.02
28.98
500
0.12
90.42
2.82
Catholic
50
62.73
60.99
400
0.31
93.25
2.37
Non-Catholic
120
13.88
19.13
100
0.00
84.02
3.09
111National all includes national public, national private, and Department of Defense Education Activity (DoDEA) schools that are located in the United States.
NOTE: School counts are rounded to nearest ten and student counts are rounded to nearest hundred. Detail may not sum to totals because of rounding.
SOURCE: U.S. Department of Education, Institute of Education Sciences, National Center for Education Statistics, National Assessment of Educational Progress (NAEP), 2022 Long-Term Trend Mathematics Assessment.
NAEP Technical DocumentationParticipation, Exclusion, and Accommodation Rates for Age 9 Reading
The following table displays the school-level participation rates and student-level participation, exclusion, and accommodation rates for the age 9 long-term trend reading assessment. Various weights were used in the calculation of the school rates, as indicated in the column headings of the table. For the student participation rates student base weights were used. For the student exclusion rates and accommodation rates, student base weights with adjustment for school nonresponse were used. Different weights were used at the student level because the student participation rates are conditional on (i.e., computed within) the participating schools, whereas the exclusion and accommodation rates are population estimates.
The school participation rates reflect the participation of the original sampled schools only and do not reflect any effect of substitution. The rates weighted by the school base weight and enrollment show the approximate proportion of the student population in the domain that is represented by the responding schools in the sample. The rates weighted
by just the base weight show the proportion of the school population that is represented by the responding schools in the sample. These rates differ because schools differ in size.
Participation, exclusion, and accommodation rates, age 9 long-term trend reading assessment, by school type and geographic region: 2022
-
School type and geographic region
Number of schools in original sample, rounded
School participation rates (percent) before substitution (weighted by base
weight and enrollment)
School participation rates (percent) before substitution (weighted by base
weight only)
Number of students sampled, rounded
Weighted percent of students excluded
Weighted student participation rates (percent) after makeups
Weighted percent
of students accommodated
National all1
580
85.93
72.56
9,200
2.34
87.13
14.18
Northeast all
90
86.73
63.95
1,300
1.90
82.35
18.66
Midwest all
110
74.94
72.78
1,500
1.20
89.58
14.13
South all
240
93.22
79.44
4,300
2.71
87.94
16.53
West all
140
82.42
68.64
2,200
3.05
86.99
7.52
National public
410
90.45
88.79
8,700
2.52
87.00
15.13
National private
160
32.02
28.98
500
0.22
90.89
3.20
Catholic
50
62.73
60.99
400
0.59
92.30
3.29
Non-Catholic
120
13.88
19.13
100
0.00
87.70
3.15
111National all includes national pub
lic, national pr
ivate, and Department
of Defense Education
Activity (DoDE
A) schools that
are located in the
United States.
NOTE: School counts are rounded to nearest ten and student counts are rounded to nearest hundred. Detail may not sum to totals because of rounding.
SOURCE: U.S. Department of Education, Institute of Education Sciences, National Center for Education Statistics, National Assessment of Educational Progress (NAEP), 2022 Long-Term Trend Reading Assessment.
NAEP Technical Documentation Participation, Exclusion, and Accommodation Rates for Grade 4 Mathematics
The following table displays the school- and student-level response, exclusion, and accommodation rates for the grade 4 mathematics assessment by school type and jurisdiction. Various weights were used in the calculation of the rates, as indicated in the column headings of the table.
The participation rates reflect the participation of the original sample schools only and do not reflect any effect of substitution. The rates weighted by the base weight and enrollment show the approximate proportion of the student population in the jurisdiction that is represented by the responding schools in the sample. The rates weighted by just the base weight show the proportion of the school population that is represented by the responding schools in the sample. These rates differ because schools differ in size.
Participation, exclusion, and accommodation rates, grade 4 mathematics combined national and state assessment, by school type and jurisdiction: 2022
-
School type and jurisdiction
Number of schools in original sample, rounded
School participation rates (percent) before
substitution (weighted by base
weight and enrollment)
School participation rates (percent) before substitution (weighted by base
weight only)
Number of students sampled, rounded
Weighted percent of students excluded
Weighted student participation rates (percent) after makeups
Weighted percent
of students accommodated
All
6,410
94.48
82.93
139,400
1.81
91.86
14.27
National all1
6,260
94.45
82.79
135,800
1.81
91.85
14.19
Northeast all
1,060
91.11
76.06
21,700
1.74
90.47
17.74
Midwest all
1,460
95.32
85.44
29,400
1.33
92.18
12.95
South all
2,170
94.70
82.26
50,600
2.12
92.51
16.69
West all
1,500
95.54
85.60
31,900
1.78
91.39
8.73
National public
5,750
99.53
99.54
130,900
1.94
91.79
14.93
Alabama
90
100.00
100.00
2,200
1.27
94.68
10.42
Alaska
130
99.20
93.50
2,100
1.01
88.61
16.83
Arizona
90
100.00
100.00
2,200
1.28
92.83
11.27
Arkansas
90
100.00
100.00
2,000
0.97
92.58
21.24
California
190
100.00
100.00
4,500
2.22
91.91
7.38
Colorado
120
99.04
98.43
2,900
1.76
91.10
11.74
Connecticut
90
100.00
100.00
2,100
2.46
91.79
17.50
Delaware
80
100.00
100.00
2,200
1.74
91.03
17.15
District of Columbia
90
100.00
100.00
2,100
2.25
88.24
25.53
Florida
210
100.00
100.00
5,400
2.69
91.80
21.68
Georgia
120
96.17
96.07
3,100
1.40
92.84
15.03
Hawaii
90
100.00
100.00
2,200
1.62
88.53
6.55
Idaho
90
100.00
100.00
2,000
0.92
93.22
10.07
Illinois
150
100.00
100.00
3,200
1.32
91.19
19.24
Indiana
90
98.63
99.22
2,000
0.45
92.77
19.67
Iowa
90
98.67
99.41
2,100
1.42
93.08
13.54
Kansas
100
100.00
100.00
2,100
1.43
92.88
10.00
Kentucky
120
100.00
100.00
2,700
1.93
94.50
16.61
111 Includes national public and national private schools located in the United States and all Department of Defense Education Activity schools, but not schools in Puerto Rico.
222 Department of Defense Education Activity schools.
NOTE: Numbers of schools are rounded to nearest ten, and numbers of students are rounded to nearest hundred. Detail may not sum to totals due to rounding. SOURCE: U.S. Department of Education, Institute of Education Sciences, National Center for Education Statistics, National Assessment of Educational Progress (NAEP), 2022 Mathematics Assessment.
-
School participation
Number of
rates (percent) before
School participation
schools in
substitution
rates (percent)
Number of
Weighted
Weighted student
original
(weighted by base
before substitution
students
percent of
participation
Weighted percent
sample,
weight and
(weighted by base
sampled,
students
rates (percent)
of students
School type and jurisdiction rounded
enrollment)
weight only)
rounded
excluded
after makeups
accommodated
Louisiana
90
100.00
100.00
2,100
1.60
92.36
19.32
Maine
110
100.00
100.00
2,000
1.51
90.46
15.87
Maryland
120
100.00
100.00
3,000
1.37
92.09
21.26
Massachusetts
130
100.00
100.00
3,100
1.91
92.84
18.33
Michigan
140
100.00
100.00
3,100
2.93
91.18
7.97
Minnesota
90
100.00
100.00
2,300
2.47
90.79
10.38
Mississippi
90
100.00
100.00
2,200
0.76
92.78
13.96
Missouri
100
100.00
100.00
2,000
0.92
94.35
12.21
Montana
130
99.95
98.56
2,100
1.00
89.77
10.64
Nebraska
100
100.00
100.00
2,200
1.23
94.76
14.14
Nevada
100
100.00
100.00
2,400
1.70
92.26
6.13
New Hampshire
100
99.15
98.79
2,200
1.28
86.89
15.94
New Jersey
90
98.72
98.91
2,000
2.03
92.15
20.06
New Mexico
120
100.00
100.00
2,600
1.58
90.58
15.72
New York
120
95.76
95.82
2,900
1.22
86.46
21.33
North Carolina
160
100.00
100.00
4,100
1.98
90.96
13.47
North Dakota
120
99.28
97.26
2,200
1.28
90.24
11.59
Ohio
140
100.00
100.00
2,800
1.21
92.78
16.60
Oklahoma
100
100.00
100.00
2,100
2.21
93.65
16.15
Oregon
90
100.00
100.00
2,200
1.55
87.89
10.17
Pennsylvania
120
99.86
99.93
3,000
2.02
92.53
14.36
Rhode Island
90
100.00
100.00
2,100
1.61
94.25
17.33
South Carolina
90
100.00
100.00
2,100
1.11
93.01
12.09
South Dakota
120
100.00
100.00
2,100
1.13
93.78
9.42
Tennessee
120
100.00
100.00
2,800
2.39
92.04
14.05
Texas
270
100.00
100.00
6,800
3.09
92.75
19.43
Utah
90
100.00
100.00
2,200
1.10
92.24
11.54
Vermont
130
100.00
100.00
2,100
1.41
88.80
16.41
-
School participation
Number of
rates (percent) before
School participation
schools in
substitution
rates (percent)
Number of
Weighted
Weighted student
original
(weighted by base
before substitution
students
percent of
participation
Weighted percent
sample,
weight and
(weighted by base
sampled,
students
rates (percent)
of students
School type and jurisdiction rounded
enrollment)
weight only)
rounded
excluded
after makeups
accommodated
Virginia
90
100.00
100.00
2,200
2.79
91.98
14.14
Washington
90
100.00
100.00
2,200
2.15
89.21
10.33
West Virginia
100
100.00
100.00
2,100
1.59
92.64
11.28
Wisconsin
130
100.00
100.00
2,700
1.29
90.27
12.14
Wyoming
100
98.78
99.16
2,100
1.27
90.11
13.57
Trial Urban (TUDA) Districts
Albuquerque
40
100.00
100.00
1,100
0.56
91.29
18.75
Atlanta
40
100.00
100.00
1,100
0.87
93.69
12.51
Austin
40
100.00
100.00
1,200
3.08
87.96
30.02
Baltimore City
50
100.00
100.00
1,000
1.39
89.82
26.15
Boston
50
100.00
100.00
1,100
5.73
90.83
19.29
Charlotte-Mecklenburg
40
100.00
100.00
1,100
2.23
92.44
12.53
Chicago
70
100.00
100.00
1,500
2.85
90.39
23.41
Clark County (NV)
60
100.00
100.00
1,600
1.16
92.17
5.76
Cleveland
50
100.00
100.00
900
2.55
88.77
24.26
Dallas
40
100.00
100.00
1,000
4.26
91.71
38.46
Denver
40
100.00
100.00
1,100
2.16
88.86
15.39
Detroit
40
100.00
100.00
1,100
4.11
89.97
7.55
Duval County (FL)
40
100.00
100.00
1,100
2.07
91.75
23.97
Fort Worth
40
100.00
100.00
1,100
2.26
93.11
18.16
Guilford County (NC)
40
100.00
100.00
1,100
1.46
92.62
15.31
Hillsborough County (FL)
40
100.00
100.00
1,100
3.14
92.13
23.08
Houston
60
100.00
100.00
1,600
3.22
93.43
22.76
Jefferson County (KY)
40
100.00
100.00
1,000
3.58
93.68
22.10
Los Angeles
60
100.00
100.00
1,600
1.98
91.97
10.61
Miami
60
100.00
100.00
1,600
3.08
94.64
25.04
Milwaukee
50
100.00
100.00
1,000
1.45
86.42
22.28
New York City
70
98.73
98.87
1,600
1.26
87.37
27.52
-
School participation
Number of
rates (percent) before
School participation
schools in
substitution
rates (percent)
Number of
Weighted
Weighted student
original
(weighted by base
before substitution
students
percent of
participation
Weighted percent
sample,
weight and
(weighted by base
sampled,
students
rates (percent)
of students
School type and jurisdiction rounded
enrollment)
weight only)
rounded
excluded
after makeups
accommodated
Philadelphia
40
98.11
99.29
1,000
4.32
93.65
21.07
San Diego
40
100.00
100.00
1,000
2.92
88.61
12.46
Shelby County (TN)
40
100.00
100.00
1,000
3.73
94.05
14.79
District of Columbia (DCPS)
50
100.00
100.00
1,300
3.30
89.57
30.10
National private
390
37.50
33.92
1,800
0.48
93.71
5.98
Catholic
120
66.61
68.59
1,100
0.37
93.67
7.03
Non-Catholic
270
20.01
20.37
700
0.54
93.77
5.36
Other jurisdictions
DoDEA2
100
94.55
92.13
3,000
1.68
88.71
17.62
Puerto Rico
150
100.00
100.00
3,500
0.16
92.19
31.52
111 Includes national public and national private schools located in the United States and all Department of Defense Education Activity schools, but not schools in Puerto Rico.
222 Department of Defense Education Activity schools.
NOTE: Numbers of schools are rounded to nearest ten, and numbers of students are rounded to nearest hundred. Detail may not sum to totals due to rounding. SOURCE: U.S. Department of Education, Institute of Education Sciences, National Center for Education Statistics, National Assessment of Educational Progress (NAEP), 2022 Mathematics Assessment.
NAEP Technical Documentation Participation, Exclusion, and Accommodation Rates for Grade 4 Reading
The following table displays the school- and student-level response, exclusion, and accommodation rates for the grade 4 reading assessment by school type and jurisdiction. Various weights were used in the calculation of the rates, as indicated in the column headings of the table.
The participation rates reflect the participation of the original sample schools only and do not reflect any effect of substitution. The rates weighted by the base weight and enrollment show the approximate proportion of the student population in the jurisdiction that is represented by the responding schools in the sample. The rates weighted by just the base weight show the proportion of the school population that is represented by the responding schools in the sample. These rates differ because schools differ in size.
Participation, exclusion, and accommodation rates, grade 4 reading combined national and state assessment, by school type and jurisdiction: 2022
-
School type and jurisdiction
Number of schools in original sample, rounded
School participation rates (percent) before
substitution (weighted by base
weight and enrollment)
School participation rates (percent) before substitution (weighted by base
weight only)
Number of students sampled, rounded
Weighted percent of students excluded
Weighted student participation rates (percent) after makeups
Weighted percent
of students accommodated
All
6,260
94.45
82.79
127,000
1.96
91.70
14.09
National all1
6,260
94.45
82.79
127,000
1.96
91.70
14.09
Northeast all
1,060
91.11
76.06
20,400
2.14
90.18
16.94
Midwest all
1,460
95.32
85.44
27,600
1.44
92.11
12.57
South all
2,170
94.70
82.26
47,200
2.22
92.36
16.86
West all
1,500
95.54
85.60
29,900
1.85
91.23
8.89
National public
5,750
99.53
99.54
122,400
2.11
91.61
14.86
Alabama
90
100.00
100.00
2,000
1.14
93.53
11.45
Alaska
130
99.20
93.50
2,000
0.61
88.73
18.28
Arizona
90
100.00
100.00
2,100
1.21
92.25
11.39
Arkansas
90
100.00
100.00
1,900
1.69
93.87
19.84
California
190
100.00
100.00
4,200
2.30
91.45
7.91
Colorado
120
99.04
98.43
2,700
2.67
91.37
10.85
Connecticut
90
100.00
100.00
2,000
2.51
88.93
17.72
Delaware
80
100.00
100.00
2,000
1.33
89.69
18.24
District of Columbia
90
100.00
100.00
1,900
4.17
87.75
23.07
Florida
210
100.00
100.00
5,000
2.37
93.05
22.65
Georgia
120
96.17
96.07
3,000
1.82
92.18
16.21
Hawaii
90
100.00
100.00
2,000
1.24
88.58
6.03
Idaho
90
100.00
100.00
1,900
1.72
92.45
10.09
Illinois
150
100.00
100.00
3,000
0.92
90.91
18.44
Indiana
90
98.63
99.22
1,900
0.68
93.09
19.87
Iowa
90
98.67
99.41
2,000
1.18
92.99
14.86
Kansas
100
100.00
100.00
1,900
0.97
93.24
10.40
Kentucky
120
100.00
100.00
2,600
3.07
93.45
16.12
Louisiana
90
100.00
100.00
1,900
2.39
92.12
17.91
111 Includes national public and national private schools located in the United States and all Department of Defense Education Activity schools.
222 Department of Defense Education Activity schools.
-
School participation
Number of
rates (percent) before
School participation
schools in
substitution
rates (percent)
Number of
Weighted
Weighted student
original
(weighted by base
before substitution
students
percent of
participation
Weighted percent
sample,
weight and
(weighted by base
sampled,
students
rates (percent)
of students
School type and jurisdiction rounded
enrollment)
weight only)
rounded
excluded
after makeups
accommodated
Maine
110
100.00
100.00
1,900
1.02
92.02
16.34
Maryland
120
100.00
100.00
2,800
1.93
91.81
21.34
Massachusetts
130
100.00
100.00
2,900
2.48
92.98
16.39
Michigan
140
100.00
100.00
2,900
2.56
90.98
8.10
Minnesota
90
100.00
100.00
2,100
3.54
91.18
10.29
Mississippi
90
100.00
100.00
2,000
1.31
92.70
13.47
Missouri
100
100.00
100.00
2,000
0.84
93.38
12.72
Montana
130
99.95
98.56
2,000
1.32
89.73
11.56
Nebraska
100
100.00
100.00
2,000
1.29
94.33
14.01
Nevada
100
100.00
100.00
2,300
1.52
91.47
7.40
New Hampshire
100
99.15
98.79
2,000
1.15
87.70
16.10
New Jersey
90
98.72
98.91
1,900
2.84
91.90
19.03
New Mexico
120
100.00
100.00
2,400
1.38
91.03
14.56
New York
120
95.76
95.82
2,700
2.23
86.57
19.98
North Carolina
160
100.00
100.00
3,800
1.86
91.11
13.85
North Dakota
120
99.28
97.26
2,100
1.70
91.16
11.76
Ohio
140
100.00
100.00
2,700
2.40
92.35
14.63
Oklahoma
100
100.00
100.00
1,900
1.67
92.40
16.62
Oregon
90
100.00
100.00
2,100
1.85
89.66
9.65
Pennsylvania
120
99.86
99.93
2,800
2.12
91.83
14.50
Rhode Island
90
100.00
100.00
2,000
1.19
93.82
17.68
South Carolina
90
100.00
100.00
2,000
1.67
92.09
12.06
South Dakota
120
100.00
100.00
2,000
1.04
93.95
9.33
Tennessee
120
100.00
100.00
2,700
2.14
91.68
14.13
Texas
270
100.00
100.00
6,400
3.28
92.44
19.82
Utah
90
100.00
100.00
2,000
1.03
92.30
10.55
Vermont
130
100.00
100.00
2,000
1.27
89.00
16.55
Virginia
90
100.00
100.00
2,000
2.25
91.86
12.33
-
School participation
Number of
rates (percent) before
School participation
schools in
substitution
rates (percent)
Number of
Weighted
Weighted student
original
(weighted by base
before substitution
students
percent of
participation
Weighted percent
sample,
weight and
(weighted by base
sampled,
students
rates (percent)
of students
School type and jurisdiction rounded
enrollment)
weight only)
rounded
excluded
after makeups
accommodated
Washington
90
100.00
100.00
2,000
1.72
88.85
9.78
West Virginia
100
100.00
100.00
1,900
1.66
90.27
10.12
Wisconsin
130
100.00
100.00
2,600
0.99
90.73
12.33
Wyoming
100
98.78
99.16
2,000
1.72
91.74
14.36
Trial Urban (TUDA) Districts
Albuquerque
40
100.00
100.00
1,000
1.34
91.29
17.90
Atlanta
40
100.00
100.00
1,000
2.76
92.78
11.45
Austin
40
100.00
100.00
1,100
5.14
89.14
28.32
Baltimore City
50
100.00
100.00
1,000
3.23
90.67
25.26
Boston
50
100.00
100.00
1,000
6.09
90.96
16.80
Charlotte-Mecklenburg
40
100.00
100.00
1,000
1.70
91.77
10.12
Chicago
70
100.00
100.00
1,400
2.26
89.02
23.88
Clark County (NV)
60
100.00
100.00
1,500
1.71
91.94
7.07
Cleveland
50
100.00
100.00
900
2.11
87.53
25.20
Dallas
40
100.00
100.00
1,000
4.18
92.41
38.31
Denver
40
100.00
100.00
1,000
3.17
90.68
13.12
Detroit
40
100.00
100.00
1,000
4.21
89.44
6.40
Duval County (FL)
40
100.00
100.00
1,000
2.08
93.11
24.16
Fort Worth
40
100.00
100.00
1,000
3.22
91.01
17.14
Guilford County (NC)
40
100.00
100.00
1,000
1.71
91.77
13.07
Hillsborough County (FL)
40
100.00
100.00
1,000
3.03
93.93
22.59
Houston
60
100.00
100.00
1,500
2.28
92.05
23.97
Jefferson County (KY)
40
100.00
100.00
1,000
6.31
92.34
17.78
Los Angeles
60
100.00
100.00
1,500
2.18
92.38
12.00
Miami
60
100.00
100.00
1,500
2.92
92.83
24.82
Milwaukee
50
100.00
100.00
900
2.32
85.33
21.67
New York City
70
98.73
98.87
1,500
2.32
87.42
26.42
Philadelphia
40
98.11
99.29
1,000
6.60
93.38
18.23
-
School participation
Number of
rates (percent) before
School participation
schools in
substitution
rates (percent)
Number of
Weighted
Weighted student
original
(weighted by base
before substitution
students
percent of
participation
Weighted percent
sample,
weight and
(weighted by base
sampled,
students
rates (percent)
of students
School type and jurisdiction rounded
enrollment)
weight only)
rounded
excluded
after makeups
accommodated
San Diego
40
100.00
100.00
900
2.75
88.59
12.38
Shelby County (TN)
40
100.00
100.00
1,000
3.82
91.22
14.68
District of Columbia (DCPS)
50
100.00
100.00
1,200
5.69
88.64
26.20
National private
390
37.50
33.92
1,600
0.25
94.12
5.49
Catholic
120
66.61
68.59
1,000
0.38
95.19
6.15
Non-Catholic
270
20.01
20.37
600
0.17
92.19
5.09
Other jurisdictions
DoDEA2
100
94.55
92.13
2,900
1.72
89.71
17.96
111 Includes national public and national private schools located in the United States and all Department of Defense Education Activity schools.
222 Department of Defense Education Activity schools.
NOTE: Numbers of schools are rounded to nearest ten, and numbers of students are rounded to nearest hundred. Detail may not sum to totals due to rounding. SOURCE: U.S. Department of Education, Institute of Education Sciences, National Center for Education Statistics, National Assessment of Educational Progress (NAEP), 2022 Reading Assessment.
NAEP Technical Documentation Participation, Exclusion, and Accommodation Rates for Grade 8 Civics
The following table displays the school- and student-level response, exclusion, and accommodation rates for the grade 8 civics assessment. Various weights were used in the calculation of the rates, as indicated in the column headings of the table.
The participation rates reflect the participation of the original sample schools only and do not reflect any effect of substitution. The rates weighted by the base weight and enrollment show the approximate proportion of the student population in the school type and geographic region that is represented by the responding schools in the sample. The rates weighted by just the base weight show the proportion of the school population that is represented by the responding schools in the sample. These rates differ because schools differ in size.
Participation, exclusion, and accommodation rates, grade 8 civics national assessment, by school type and geographic region: 2022
-
School type and geographic region
Number of schools in original sample, rounded
School participation rates (percent) before substitution (weighted by base
weight and enrollment)
School participation rates (percent) before substitution (weighted by base
weight only)
Number of students sampled, rounded
Weighted percent of students excluded
Weighted student participation rates (percent) after makeups
Weighted percent
of students accommodated
All
570
86.62
69.97
9,400
1.52
90.05
13.25
National all1
570
86.62
69.97
9,400
1.52
90.05
13.25
Northeast all
90
82.11
60.26
1,200
1.36
88.37
17.65
Midwest all
110
87.34
71.53
1,800
1.39
91.26
13.01
South all
230
91.46
73.39
4,200
1.51
90.52
14.91
West all
140
80.38
69.74
2,100
1.77
88.99
7.73
National public
400
91.00
91.88
8,800
1.65
89.96
14.04
National private
170
33.59
33.24
600
0.00
92.30
4.12
Catholic
40
61.74
74.36
400
0.00
91.89
5.34
Non-Catholic
130
15.03
17.71
200
0.00
93.55
3.32
111 Includes national public, national private, and Department of Defense Education Activity schools located in the United States.
NOTE: Numbers of schools are rounded to nearest ten, and numbers of students are rounded to nearest hundred. Detail may not sum to totals due to rounding. SOURCE: U.S. Department of Education, Institute of Education Sciences, National Center for Education Statistics, National Assessment of Educational Progress (NAEP), 2022 Civics Assessment.
NAEP Technical Documentation Participation, Exclusion, and Accommodation Rates for Grade 8 Mathematics
The following table displays the school- and student-level response, exclusion, and accommodation rates for the grade 8 mathematics assessment by school type and jurisdiction. Various weights were used in the calculation of the rates, as indicated in the column headings of the table.
The participation rates reflect the participation of the original sample schools only and do not reflect any effect of substitution. The rates weighted by the base weight and enrollment show the approximate proportion of the student population in the jurisdiction that is represented by the responding schools in the sample. The rates weighted by just the base weight show the proportion of the school population that is represented by the responding schools in the sample. These rates differ because schools differ in size.
Participation, exclusion, and accommodation rates, grade 8 mathematics combined national and state assessment, by school type and jurisdiction: 2022
-
School type and jurisdiction
Number of schools in original sample, rounded
School participation rates (percent) before
substitution (weighted by base
weight and enrollment)
School participation rates (percent) before substitution (weighted by base
weight only)
Number of students sampled, rounded
Weighted percent of students excluded
Weighted student participation rates (percent) after makeups
Weighted percent
of students accommodated
All
5,870
94.69
74.55
138,700
1.53
88.87
13.75
National all1
5,730
94.67
74.35
135,100
1.54
88.86
13.67
Northeast all
950
91.21
62.39
21,700
1.57
86.65
17.75
Midwest all
1,370
95.37
77.07
29,700
1.16
89.24
12.52
South all
2,000
95.51
75.16
50,100
1.65
90.00
15.17
West all
1,350
94.96
80.42
32,000
1.69
88.01
9.45
National public
5,280
99.61
99.50
131,300
1.67
88.68
14.42
Alabama
90
100.00
100.00
2,100
1.64
91.21
9.15
Alaska
110
98.71
93.92
2,000
1.05
83.79
14.47
Arizona
90
100.00
100.00
2,100
1.67
90.30
9.94
Arkansas
90
100.00
100.00
2,200
0.98
91.18
19.69
California
180
100.00
100.00
4,400
2.16
88.05
8.73
Colorado
120
96.76
95.47
2,800
1.36
86.46
10.41
Connecticut
90
98.77
97.80
2,000
1.69
87.84
17.79
Delaware
50
100.00
100.00
2,100
1.90
87.27
17.75
District of Columbia
80
100.00
100.00
2,000
2.74
82.67
25.65
Florida
210
100.00
100.00
5,400
2.56
89.47
22.03
Georgia
110
100.00
100.00
3,100
1.75
90.25
16.63
Hawaii
50
100.00
100.00
2,200
1.99
85.29
4.37
Idaho
90
100.00
100.00
2,200
1.22
90.48
11.37
Illinois
140
100.00
100.00
3,300
1.12
87.95
16.25
Indiana
90
98.83
99.41
2,000
0.73
90.54
18.17
Iowa
90
100.00
100.00
2,100
1.48
90.13
15.07
Kansas
90
100.00
100.00
2,200
1.32
91.03
10.74
Kentucky
110
100.00
100.00
2,800
2.32
89.43
14.25
Louisiana
90
100.00
100.00
2,100
2.28
89.70
20.14
Maine
90
97.56
96.39
2,100
0.99
86.84
18.58
111 Includes national public and national private schools located in the United States and all Department of Defense Education Activity schools, but not schools in Puerto Rico.
222 Department of Defense Education Activity schools.
NOTE: Numbers of schools are rounded to nearest ten, and numbers of students are rounded to nearest hundred. Detail may not sum to totals due to rounding. SOURCE: U.S. Department of Education, Institute of Education Sciences, National Center for Education Statistics, National Assessment of Educational Progress (NAEP), 2022 Mathematics Assessment.
-
School participation
Number of
rates (percent) before
School participation
schools in
substitution
rates (percent)
Number of
Weighted
Weighted student
original
(weighted by base
before substitution
students
percent of
participation
Weighted percent
sample,
weight and
(weighted by base
sampled,
students
rates (percent)
of students
School type and jurisdiction rounded
enrollment)
weight only)
rounded
excluded
after makeups
accommodated
Maryland
130
100.00
100.00
3,000
1.82
89.06
18.06
Massachusetts
130
100.00
100.00
3,000
2.62
87.89
17.83
Michigan
130
100.00
100.00
3,000
1.80
86.82
10.49
Minnesota
100
98.62
99.16
1,900
2.08
85.74
8.79
Mississippi
90
100.00
100.00
2,200
0.84
90.09
12.25
Missouri
100
100.00
100.00
2,200
0.99
91.73
11.54
Montana
100
99.95
98.06
2,100
1.17
85.81
12.23
Nebraska
100
100.00
100.00
2,200
1.76
92.46
12.69
Nevada
90
100.00
100.00
2,400
1.10
87.92
6.89
New Hampshire
80
98.97
98.63
2,100
1.48
82.00
12.45
New Jersey
90
98.85
99.47
2,100
1.61
91.20
19.77
New Mexico
100
100.00
100.00
2,700
1.67
88.36
14.40
New York
130
97.65
97.92
2,900
1.65
81.09
20.63
North Carolina
140
100.00
100.00
3,900
1.14
90.32
13.01
North Dakota
90
100.00
100.00
2,100
1.38
88.51
12.28
Ohio
140
100.00
100.00
2,900
1.11
89.59
16.08
Oklahoma
90
100.00
100.00
2,100
1.61
92.11
14.99
Oregon
90
100.00
100.00
2,100
1.51
84.92
10.91
Pennsylvania
120
99.42
99.75
2,900
1.35
89.04
16.94
Rhode Island
60
100.00
100.00
2,100
2.22
90.48
16.63
South Carolina
90
100.00
100.00
2,100
1.47
91.36
10.12
South Dakota
100
98.95
98.85
2,200
1.62
91.16
6.87
Tennessee
120
97.51
96.30
3,000
2.30
90.98
12.11
Texas
220
100.00
100.00
6,600
1.56
89.72
15.94
Utah
90
100.00
100.00
2,200
1.67
87.70
12.50
Vermont
90
100.00
100.00
2,200
1.72
87.05
16.37
Virginia
90
98.75
99.52
2,100
1.70
88.42
12.39
Washington
90
100.00
100.00
2,200
1.37
86.92
10.88
-
School participation
Number of
rates (percent) before
School participation
schools in
substitution
rates (percent)
Number of
Weighted
Weighted student
original
(weighted by base
before substitution
students
percent of
participation
Weighted percent
sample,
weight and
(weighted by base
sampled,
students
rates (percent)
of students
School type and jurisdiction rounded
enrollment)
weight only)
rounded
excluded
after makeups
accommodated
West Virginia
90
100.00
100.00
2,200
1.52
90.99
11.68
Wisconsin
130
100.00
100.00
3,100
1.26
87.83
12.25
Wyoming
70
100.00
100.00
2,200
1.41
87.33
11.99
Trial Urban (TUDA) Districts
Albuquerque
30
100.00
100.00
1,100
1.92
85.50
15.81
Atlanta
30
100.00
100.00
1,000
0.90
90.39
19.32
Austin
20
100.00
100.00
1,100
1.94
84.80
25.07
Baltimore City
50
100.00
100.00
1,000
2.86
90.04
21.19
Boston
50
100.00
100.00
1,000
5.94
88.86
19.68
Charlotte-Mecklenburg
30
100.00
100.00
1,100
3.11
89.89
11.80
Chicago
70
100.00
100.00
1,600
0.95
88.15
25.00
Clark County (NV)
50
100.00
100.00
1,600
1.29
85.93
7.37
Cleveland
50
100.00
100.00
900
3.82
87.12
21.92
Dallas
40
100.00
100.00
1,100
2.21
91.02
22.29
Denver
40
92.34
98.48
1,000
2.70
87.68
13.03
Detroit
40
100.00
100.00
1,000
5.02
88.79
11.55
Duval County (FL)
40
100.00
100.00
1,100
1.53
91.37
21.43
Fort Worth
30
100.00
100.00
1,000
2.24
91.81
14.09
Guilford County (NC)
30
100.00
100.00
1,000
1.77
89.25
14.89
Hillsborough County (FL)
40
100.00
100.00
1,100
2.25
90.53
21.08
Houston
40
100.00
100.00
1,500
3.03
88.66
15.70
Jefferson County (KY)
30
100.00
100.00
1,100
1.46
91.05
15.00
Los Angeles
60
100.00
100.00
1,600
2.33
88.71
9.72
Miami
70
100.00
100.00
1,600
3.57
91.25
18.20
Milwaukee
40
100.00
100.00
1,100
2.12
80.38
23.55
New York City
70
96.75
95.00
1,600
0.69
83.59
25.12
Philadelphia
40
91.14
98.36
1,000
4.47
86.81
20.70
San Diego
40
100.00
100.00
1,000
1.80
85.52
12.45
-
School participation
Number of
rates (percent) before
School participation
schools in
substitution
rates (percent)
Number of
Weighted
Weighted student
original
(weighted by base
before substitution
students
percent of
participation
Weighted percent
sample,
weight and
(weighted by base
sampled,
students
rates (percent)
of students
School type and jurisdiction rounded
enrollment)
weight only)
rounded
excluded
after makeups
accommodated
Shelby County (TN)
40
100.00
100.00
1,100
2.77
90.34
9.39
District of Columbia (DCPS)
30
100.00
100.00
1,000
3.94
81.92
27.63
National private
380
35.49
32.62
1,600
0.00
93.97
4.84
Catholic
110
60.98
65.94
1,000
0.00
94.09
6.83
Non-Catholic
270
19.80
20.04
600
0.00
93.74
3.61
Other jurisdictions
DoDEA2
60
94.14
86.27
2,100
1.12
89.55
13.29
Puerto Rico
150
100.00
100.00
3,600
0.06
91.07
30.04
111 Includes national public and national private schools located in the United States and all Department of Defense Education Activity schools, but not schools in Puerto Rico.
222 Department of Defense Education Activity schools.
NOTE: Numbers of schools are rounded to nearest ten, and numbers of students are rounded to nearest hundred. Detail may not sum to totals due to rounding. SOURCE: U.S. Department of Education, Institute of Education Sciences, National Center for Education Statistics, National Assessment of Educational Progress (NAEP), 2022 Mathematics Assessment.
NAEP Technical Documentation Participation, Exclusion, and Accommodation Rates for Grade 8 Reading
The following table displays the school- and student-level response, exclusion, and accommodation rates for the grade 8 reading assessment by school type and jurisdiction. Various weights were used in the calculation of the rates, as indicated in the column headings of the table. The participation rates reflect the participation of the original sample schools only and do not reflect any effect of substitution. The rates weighted by the base weight and enrollment show the approximate proportion of the student population in the jurisdiction that is represented by the responding schools in the sample. The rates weighted by just the base weight show the proportion of the school population that is represented by the responding schools in the sample. These rates differ because schools differ in size.
Participation, exclusion, and accommodation rates, grade 8 reading combined national and state assessment, by school type and jurisdiction: 2022
-
School type and jurisdiction
Number of schools in original sample, rounded
School participation rates (percent) before
substitution (weighted by base
weight and enrollment)
School participation rates (percent) before substitution (weighted by base
weight only)
Number of students sampled, rounded
Weighted percent of students excluded
Weighted student participation rates (percent) after makeups
Weighted percent
of students accommodated
All
5,730
94.67
74.35
135,200
1.75
89.02
13.19
National all1
5,730
94.67
74.35
135,200
1.75
89.02
13.19
Northeast all
950
91.21
62.39
21,700
1.95
86.87
17.51
Midwest all
1,370
95.37
77.07
29,800
1.13
89.30
11.91
South all
2,000
95.51
75.16
50,100
1.95
90.39
14.72
West all
1,350
94.96
80.42
32,000
1.86
87.84
8.90
National public
5,280
99.61
99.50
131,400
1.89
88.82
13.86
Alabama
90
100.00
100.00
2,100
0.98
92.41
9.08
Alaska
110
98.71
93.92
2,100
0.48
82.03
15.08
Arizona
90
100.00
100.00
2,100
1.77
89.78
9.41
Arkansas
90
100.00
100.00
2,200
1.63
91.43
18.33
California
180
100.00
100.00
4,400
2.48
88.09
7.74
Colorado
120
96.76
95.47
2,800
1.95
86.94
10.67
Connecticut
90
98.77
97.80
2,100
1.77
88.43
16.40
Delaware
50
100.00
100.00
2,100
1.49
87.58
18.91
District of Columbia
80
100.00
100.00
2,000
3.07
83.75
24.58
Florida
210
100.00
100.00
5,400
2.34
87.36
22.00
Georgia
110
100.00
100.00
3,100
1.97
92.79
16.63
Hawaii
50
100.00
100.00
2,200
1.56
83.42
4.96
Idaho
90
100.00
100.00
2,200
1.83
91.03
10.68
Illinois
140
100.00
100.00
3,300
1.28
88.38
15.29
Indiana
90
98.83
99.41
2,000
0.51
90.34
16.35
Iowa
90
100.00
100.00
2,100
1.18
90.16
15.87
Kansas
90
100.00
100.00
2,200
1.37
92.93
9.85
Kentucky
110
100.00
100.00
2,800
2.05
91.10
14.91
Louisiana
90
100.00
100.00
2,100
2.85
89.24
18.44
Maine
90
97.56
96.39
2,100
1.32
89.52
18.39
Maryland
130
100.00
100.00
3,000
1.87
90.36
18.17
111 Includes national public and national private schools located in the United States and all Department of Defense Education Activity schools.
222 Department of Defense Education Activity schools.
NOTE: Numbers of schools are rounded to nearest ten, and numbers of students are rounded to nearest hundred. Detail may not sum to totals due to rounding. SOURCE: U.S. Department of Education, Institute of Education Sciences, National Center for Education Statistics, National Assessment of Educational Progress (NAEP), 2022 Reading Assessment.
-
School participation
Number of
rates (percent) before
School participation
schools in
substitution
rates (percent)
Number of
Weighted
Weighted student
original
(weighted by base
before substitution
students
percent of
participation
Weighted percent
sample,
weight and
(weighted by base
sampled,
students
rates (percent)
of students
School type and jurisdiction rounded
enrollment)
weight only)
rounded
excluded
after makeups
accommodated
Massachusetts
130
100.00
100.00
3,000
2.80
88.83
16.89
Michigan
130
100.00
100.00
3,000
1.54
86.24
11.11
Minnesota
100
98.62
99.16
1,900
1.95
84.69
8.52
Mississippi
90
100.00
100.00
2,200
0.68
91.75
12.96
Missouri
100
100.00
100.00
2,200
1.20
92.49
10.61
Montana
100
99.95
98.06
2,100
0.84
87.24
11.73
Nebraska
100
100.00
100.00
2,200
1.43
92.69
11.41
Nevada
90
100.00
100.00
2,400
1.13
88.06
5.09
New Hampshire
80
98.97
98.63
2,100
1.04
84.57
12.87
New Jersey
90
98.85
99.47
2,100
2.24
89.50
19.35
New Mexico
100
100.00
100.00
2,700
1.69
87.17
12.68
New York
130
97.65
97.92
2,900
2.21
81.82
20.55
North Carolina
140
100.00
100.00
4,000
1.90
89.15
12.43
North Dakota
90
100.00
100.00
2,100
1.53
88.82
11.96
Ohio
140
100.00
100.00
2,900
1.39
89.39
15.95
Oklahoma
90
100.00
100.00
2,100
2.35
92.72
12.65
Oregon
90
100.00
100.00
2,100
0.88
85.28
10.92
Pennsylvania
120
99.42
99.75
2,900
1.72
89.13
17.47
Rhode Island
60
100.00
100.00
2,100
1.69
89.57
17.35
South Carolina
90
100.00
100.00
2,100
1.35
92.35
11.20
South Dakota
100
98.95
98.85
2,200
1.75
91.64
5.95
Tennessee
120
97.51
96.30
2,900
2.69
89.14
11.95
Texas
220
100.00
100.00
6,600
2.19
90.81
14.66
Utah
90
100.00
100.00
2,200
1.31
87.55
12.96
Vermont
90
100.00
100.00
2,200
1.67
86.98
16.15
Virginia
90
98.75
99.52
2,100
2.45
89.02
10.22
Washington
90
100.00
100.00
2,200
1.54
85.49
9.42
West Virginia
90
100.00
100.00
2,200
1.73
90.88
10.09
-
School participation
Number of
rates (percent) before
School participation
schools in
substitution
rates (percent)
Number of
Weighted
Weighted student
original
(weighted by base
before substitution
students
percent of
participation
Weighted percent
sample,
weight and
(weighted by base
sampled,
students
rates (percent)
of students
School type and jurisdiction rounded
enrollment)
weight only)
rounded
excluded
after makeups
accommodated
Wisconsin
130
100.00
100.00
3,100
0.82
88.02
12.48
Wyoming
70
100.00
100.00
2,200
1.68
87.19
12.90
Trial Urban (TUDA) Districts
Albuquerque
30
100.00
100.00
1,100
1.10
86.92
14.47
Atlanta
30
100.00
100.00
1,000
2.75
90.57
17.20
Austin
20
100.00
100.00
1,100
2.02
86.68
24.02
Baltimore City
50
100.00
100.00
1,000
2.85
90.61
21.72
Boston
50
100.00
100.00
1,000
5.72
87.12
17.28
Charlotte-Mecklenburg
30
100.00
100.00
1,100
2.68
89.31
10.90
Chicago
70
100.00
100.00
1,600
1.51
88.67
22.36
Clark County (NV)
50
100.00
100.00
1,600
1.24
86.43
5.57
Cleveland
50
100.00
100.00
900
3.91
89.60
23.11
Dallas
40
100.00
100.00
1,100
3.12
93.27
22.83
Denver
40
92.34
98.48
1,000
2.59
88.48
13.41
Detroit
40
100.00
100.00
1,000
5.10
87.61
11.23
Duval County (FL)
40
100.00
100.00
1,100
1.77
92.24
20.80
Fort Worth
30
100.00
100.00
1,000
1.41
91.91
14.01
Guilford County (NC)
30
100.00
100.00
1,000
1.02
89.39
15.27
Hillsborough County (FL)
40
100.00
100.00
1,100
3.18
88.96
20.16
Houston
40
100.00
100.00
1,500
3.65
89.49
14.45
Jefferson County (KY)
30
100.00
100.00
1,100
1.90
91.78
16.16
Los Angeles
60
100.00
100.00
1,600
2.42
89.78
9.27
Miami
70
100.00
100.00
1,600
3.34
90.11
18.85
Milwaukee
40
100.00
100.00
1,100
1.22
83.36
25.27
New York City
70
96.75
95.00
1,600
1.12
84.41
25.99
Philadelphia
40
91.14
98.36
1,000
5.13
88.26
19.72
San Diego
40
100.00
100.00
1,000
2.26
88.48
9.35
Shelby County (TN)
40
100.00
100.00
1,100
2.63
89.30
9.79
-
School participation
Number of
rates (percent) before
School participation
schools in
substitution
rates (percent)
Number of
Weighted
Weighted student
original
(weighted by base
before substitution
students
percent of
participation
Weighted percent
sample,
weight and
(weighted by base
sampled,
students
rates (percent)
of students
School type and jurisdiction rounded
enrollment)
weight only)
rounded
excluded
after makeups
accommodated
District of Columbia (DCPS)
30
100.00
100.00
1,000
4.32
83.17
26.65
National private
380
35.49
32.62
1,600
0.14
94.86
5.36
Catholic
110
60.98
65.94
1,000
0.00
95.42
7.43
Non-Catholic
270
19.80
20.04
600
0.22
93.72
4.07
Other jurisdictions
DoDEA2
60
94.14
86.27
2,100
1.78
89.68
12.42
111 Includes national public and national private schools located in the United States and all Department of Defense Education Activity schools.
222 Department of Defense Education Activity schools.
NOTE: Numbers of schools are rounded to nearest ten, and numbers of students are rounded to nearest hundred. Detail may not sum to totals due to rounding. SOURCE: U.S. Department of Education, Institute of Education Sciences, National Center for Education Statistics, National Assessment of Educational Progress (NAEP), 2022 Reading Assessment.
NAEP Technical Documentation Participation, Exclusion, and Accommodation Rates for Grade 8 U.S. History
The following table displays the school- and student-level response, exclusion, and accommodation rates for the grade 8 U.S history assessment. Various weights were used in the calculation of the rates, as indicated in the column headings of the table.
The participation rates reflect the participation of the original sample schools only and do not reflect any effect of substitution. The rates weighted by the base weight and enrollment show the approximate proportion of the student population in the school type and geographic region that is represented by the responding schools in the sample. The rates weighted by just the base weight show the proportion of the school population that is represented by the responding schools in the sample. These rates differ because schools differ in size.
Participation, exclusion, and accommodation rates, grade 8 U.S. history national assessment, by school type and geographic region: 2022
-
School type and geographic region
Number of schools in original sample, rounded
School participation rates (percent) before substitution (weighted by base
weight and enrollment)
School participation rates (percent) before substitution (weighted by base
weight only)
Number of students sampled, rounded
Weighted percent of students excluded
Weighted student participation rates (percent) after makeups
Weighted percent
of students accommodated
All
570
86.62
69.97
9,600
1.66
89.73
12.98
National all1
570
86.62
69.97
9,600
1.66
89.73
12.98
Northeast all
90
82.11
60.26
1,300
1.75
88.70
16.95
Midwest all
110
87.34
71.53
1,900
1.20
90.95
11.47
South all
230
91.46
73.39
4,300
1.80
89.71
15.50
West all
140
80.38
69.74
2,200
1.76
89.20
7.50
National public
400
91.00
91.88
9,000
1.80
89.58
13.80
National private
170
33.59
33.24
600
0.00
93.57
3.40
Catholic
40
61.74
74.36
400
0.00
94.26
5.65
Non-Catholic
130
15.03
17.71
200
0.00
91.51
1.92
111 Includes national public, national private, and Department of Defense Education Activity schools located in the United States.
NOTE: Numbers of schools are rounded to nearest ten, and numbers of students are rounded to nearest hundred. Detail may not sum to totals due to rounding. SOURCE: U.S. Department of Education, Institute of Education Sciences, National Center for Education Statistics, National Assessment of Educational Progress (NAEP), 2022 U.S. History Assessment.
NAEP Technical Documentation Nonresponse Bias Analyses
NCES statistical standards call for a nonresponse bias analysis for NAEP when response rates at the school or student level fall below 85 percent. To meet this requirement, separate nonresponse bias analysis (NRBA) reports were written in 2022 for each of the following NAEP samples: mathematics and reading at grades 4 and 8, civics and U.S. history at grade 8, mathematics and reading at age 9, and mathematics and reading at age 13. In addition to these reports, due to special interest in Catholic schools, a separate NRBA was conducted for this subgroup for the mathematics and reading sample at grades 4 and 8.
For the 2022 mathematics and reading assessments at grades 4 and 8, school-level response rates for private schools fell below the 85 percent threshold at both grades, while the response rates for all public school domains were above 85 percent at both grades. At the student level, response rates at grade 8 fell below 85 percent for at least one subject for the following state domains: Alaska, District of Columbia, Hawaii, New Hampshire, and New York; and the following TUDA domains: District of Columbia Public Schools, New York City, and Milwaukee. However, at grade 4, response rates for all domains were above 85 percent.
For the 2022 civics and U.S. history assessments at grade 8, response rates for private schools fell below the 85 percent threshold. At the student level, response rates for all reporting groups in this sample were above 85 percent. Similarly, for the 2022 mathematics and reading assessments at ages 9 and 13, only response rates for private schools
fell below 85 percent. Response rates for students across all reporting groups in these samples exceeded the 85 percent threshold.
The procedures and results from these analyses are summarized briefly below. The analyses conducted consider only certain characteristics of schools and students. They do not directly consider the effects of the nonresponse on student achievement, the primary focus of NAEP. Thus, these analyses cannot be conclusive of either the existence or absence of nonresponse bias for student achievement. For more details on these analyses, please see the full reports listed below:
NAEP 2022
NRBA Report
for Math
and Reading
at Grades
4 and
8
![]() NAEP 2022
NRBA Report for Civics
and U.S. History at Grade 8
NAEP 2022
NRBA Report for Civics
and U.S. History at Grade 8
![]() NAEP 2022 NRBA
Report for LTT at Age
9
NAEP 2022 NRBA
Report for LTT at Age
9
![]()
NAEP
2022 NRBA
Report for
LTT at
Age 13
![]()
NAEP
2022 NRBA
Report for
Math and
Reading at
Grades 4
and 8
for Catholic
Schools
![]()
School-level Nonresponse Bias Analyses
Each school-level analysis is typically conducted in three parts. The first part of the analysis looks for potential nonresponse bias that was introduced through school nonresponse. The second part examines the remaining potential for nonresponse bias after accounting for the effects of substitution. The third part examines the remaining potential for nonresponse bias after accounting for the effects of both school substitution and school-level nonresponse weight adjustments. The characteristics examined were census region, private school reporting group (Catholic/non-Catholic), urban-centric locale, school grade size category, and race/ethnicity percentages. In addition, two measures of the mean size of enrollment in the respective grades were considered: one is the mean grade enrollment size, i.e., mean size of school attended by an average student, which is estimated using the enrollment-size-adjusted school weight; and the other is mean-estimated grade enrollment, which is estimated using the school weight without the enrollment size adjustment. For each of the three samples, the NRBA results are summarized below.
Mathematics and Reading for Private Schools at Grades 4 and 8
NRBA showed that substitution and nonresponse adjustments decreased the number of variables with significant differences. As with prior years, nonresponse adjustments decreased nonresponse bias in each sample, because the key variable "private school reporting group" in each sample became non-significant after substitution and nonresponse adjustments. The biases of other variables, however, were still significant, or newly significant, after nonresponse adjustments.
![]() For grade
4, the
results for
census region
and mean
grade enrollment
averaged across
students remained
significant after
substitution and
nonresponse adjustments.
For grade
4, the
results for
census region
and mean
grade enrollment
averaged across
students remained
significant after
substitution and
nonresponse adjustments.
![]() For grade
8, the
results for
census region,
school size
class, mean
grade enrollment
averaged across
students, and
percent Black
(non-Hispanic) still
have significant
bias after nonresponse adjustments.
For grade
8, the
results for
census region,
school size
class, mean
grade enrollment
averaged across
students, and
percent Black
(non-Hispanic) still
have significant
bias after nonresponse adjustments.
These results suggest that, even after making nonresponse adjustments, there is possibly significant nonresponse bias in the NAEP achievement results for private schools because non-trivial statistically significant differences remain between the responding and original samples for census region and mean grade enrollment averaged across students for grades 4 and 8, and for school size class and percentage Black (non-Hispanic) for grade 8. Compared with the 2019 NAEP assessment, private school response rates for NAEP 2022 were approximately 14 to 15 percentage points lower for each grade.
Civics and U.S. History at Grade 8
NRBA demonstrated that in private schools, substitution had little effect on reducing nonresponse bias. In contrast, as a result of the nonresponse adjustments, both Catholic and non-Catholic schools no longer showed nonresponse bias. Still, a significant bias remained for school size and mean grade enrollment. These two remaining biases may be explained by the following. School size is not one of the variables used to adjust for school nonresponse; thus, using the nonresponse adjusted weights would not help reduce bias for school size. The increase in bias for mean grade enrollment averaged across students could be because nonresponse adjustments had removed substantial bias from other groups, such as Catholic/Non-Catholic, which limited the ability to fully adjust for other school characteristics.
These results suggest that, even after nonresponse adjustments, there is possibly significant nonresponse bias in the NAEP achievement results for private schools because non- trivial statistically significant differences remain between the responding and original samples for school size and mean grade enrollment averaged across students.
Mathematics and Reading at Ages 9 and 13
As expected, because very few substitute schools participated at either age, substitution had little effect on reducing nonresponse bias for private schools. Nonresponse adjustments were more effective: for both ages, after adjustments the number of characteristics with significant biases was decreased and the significant bias for Catholics and non-Catholics was removed. For age 9 however, the nonresponse adjustments did not eliminate significant bias across all characteristics of the sample: though the bias decreased for the Midwest and South census regions, the bias increased for the Northeast and West regions and remained significant for the census region overall. For age 13, the nonresponse adjustments eliminated significant bias across the characteristics that had exhibited bias after substitution, but significant bias was introduced for mean enrollment averaged across students. Private school samples are small, which could explain these increases for both ages. The bias may also be due to nonresponse adjustments making some important variables less biased, with the trade-off being an increase in bias for other variables.
These results suggest that, even after nonresponse adjustments, there is possibly significant nonresponse bias in the NAEP achievement results for private schools because non- trivial statistically significant differences remain between the responding and original samples for census region at age 9 and mean enrollment averaged across students at age 13.
Mathematics and Reading at Grades 4 and 8 for Catholic Schools
For grade 4 Catholic schools, nonresponse adjustment and substitution reduced the absolute bias for census region to 0 percent since census region is explicitly used to form nonresponse adjustment cells. Based on the results of the nonresponse bias analysis, there is no evidence that the responding Catholic school sample is biased from the original eligible Catholic school sample. For grade 8 Catholic schools, after nonresponse adjustment and substitution, the absolute bias for percent Black increased. Because the nonresponse adjustments removed substantial bias from other groups, including the census region, the ability to fully adjust for other school characteristics was very limited. After the nonresponse adjustment and the substitution, a new significant characteristic, school class size was introduced. As school size is not one of the variables used in the nonresponse weighting adjustment, use of the nonresponse adjusted weights may not reduce bias for school size categories.
These results suggest that, even after nonresponse adjustments, there is possibly significant nonresponse bias in the NAEP achievement results for Catholic schools because non-trivial statistically significant differences remain between the responding and original samples for school size class and percentage Black (Non-Hispanic) for grade 8.
Student-level Nonresponse Bias Analyses
For the 2022 mathematics and reading assessments at grades 4 and 8, at the student-level, response rates fell below the critical 85 percent threshold for fourteen reporting domain and subject combinations at grade 8: New York, New York City TUDA, Alaska, District of Columbia, District of Columbia Public Schools (TUDA), and Milwaukee TUDA in both mathematics and reading; Hawaii in reading only; and New Hampshire in mathematics only. After student nonresponse adjustments, there is no evidence of substantial bias in these jurisdictions as a result of student nonresponse.
Each student-level analysis was conducted in two parts. The first part of the analysis examined the potential for nonresponse bias that was introduced through student nonresponse. The second part examined the potential for bias after accounting for the effects of nonresponse weighting adjustments. The characteristics examined were gender, race/ethnicity, relative age, National School Lunch Program eligibility, student disability (SD) status, and English learner (EL) status.
| File Type | application/vnd.openxmlformats-officedocument.wordprocessingml.document |
| File Modified | 0000-00-00 |
| File Created | 0000-00-00 |
© 2025 OMB.report | Privacy Policy